|
ATCC
204305 a fumigatus strain 204305 A Fumigatus Strain, supplied by ATCC, used in various techniques. Bioz Stars score: 98/100, based on 1 PubMed citations. ZERO BIAS - scores, article reviews, protocol conditions and more https://www.bioz.com/result/204305 a fumigatus strain/product/ATCC Average 98 stars, based on 1 article reviews
204305 a fumigatus strain - by Bioz Stars,
2026-03
98/100 stars
|
Buy from Supplier |
|
ATCC
escherichia coli  Escherichia Coli, supplied by ATCC, used in various techniques. Bioz Stars score: 97/100, based on 1 PubMed citations. ZERO BIAS - scores, article reviews, protocol conditions and more https://www.bioz.com/result/escherichia coli/product/ATCC Average 97 stars, based on 1 article reviews
escherichia coli - by Bioz Stars,
2026-03
97/100 stars
|
Buy from Supplier |
|
ATCC
reference strain e coli atcc 25922  Reference Strain E Coli Atcc 25922, supplied by ATCC, used in various techniques. Bioz Stars score: 99/100, based on 1 PubMed citations. ZERO BIAS - scores, article reviews, protocol conditions and more https://www.bioz.com/result/reference strain e coli atcc 25922/product/ATCC Average 99 stars, based on 1 article reviews
reference strain e coli atcc 25922 - by Bioz Stars,
2026-03
99/100 stars
|
Buy from Supplier |
|
Addgene inc
red glifon 300 3000  Red Glifon 300 3000, supplied by Addgene inc, used in various techniques. Bioz Stars score: 93/100, based on 1 PubMed citations. ZERO BIAS - scores, article reviews, protocol conditions and more https://www.bioz.com/result/red glifon 300 3000/product/Addgene inc Average 93 stars, based on 1 article reviews
red glifon 300 3000 - by Bioz Stars,
2026-03
93/100 stars
|
Buy from Supplier |
|
ATCC
monkeypox virus mpxv iib strain mpxv france irba2211i 2022  Monkeypox Virus Mpxv Iib Strain Mpxv France Irba2211i 2022, supplied by ATCC, used in various techniques. Bioz Stars score: 94/100, based on 1 PubMed citations. ZERO BIAS - scores, article reviews, protocol conditions and more https://www.bioz.com/result/monkeypox virus mpxv iib strain mpxv france irba2211i 2022/product/ATCC Average 94 stars, based on 1 article reviews
monkeypox virus mpxv iib strain mpxv france irba2211i 2022 - by Bioz Stars,
2026-03
94/100 stars
|
Buy from Supplier |
|
ATCC
e coli type strain atcc 11775 in vitro  E Coli Type Strain Atcc 11775 In Vitro, supplied by ATCC, used in various techniques. Bioz Stars score: 99/100, based on 1 PubMed citations. ZERO BIAS - scores, article reviews, protocol conditions and more https://www.bioz.com/result/e coli type strain atcc 11775 in vitro/product/ATCC Average 99 stars, based on 1 article reviews
e coli type strain atcc 11775 in vitro - by Bioz Stars,
2026-03
99/100 stars
|
Buy from Supplier |
|
GE Healthcare
e coli bl21 strain de3  E Coli Bl21 Strain De3, supplied by GE Healthcare, used in various techniques. Bioz Stars score: 94/100, based on 1 PubMed citations. ZERO BIAS - scores, article reviews, protocol conditions and more https://www.bioz.com/result/e coli bl21 strain de3/product/GE Healthcare Average 94 stars, based on 1 article reviews
e coli bl21 strain de3 - by Bioz Stars,
2026-03
94/100 stars
|
Buy from Supplier |
|
ATCC
genomic dna 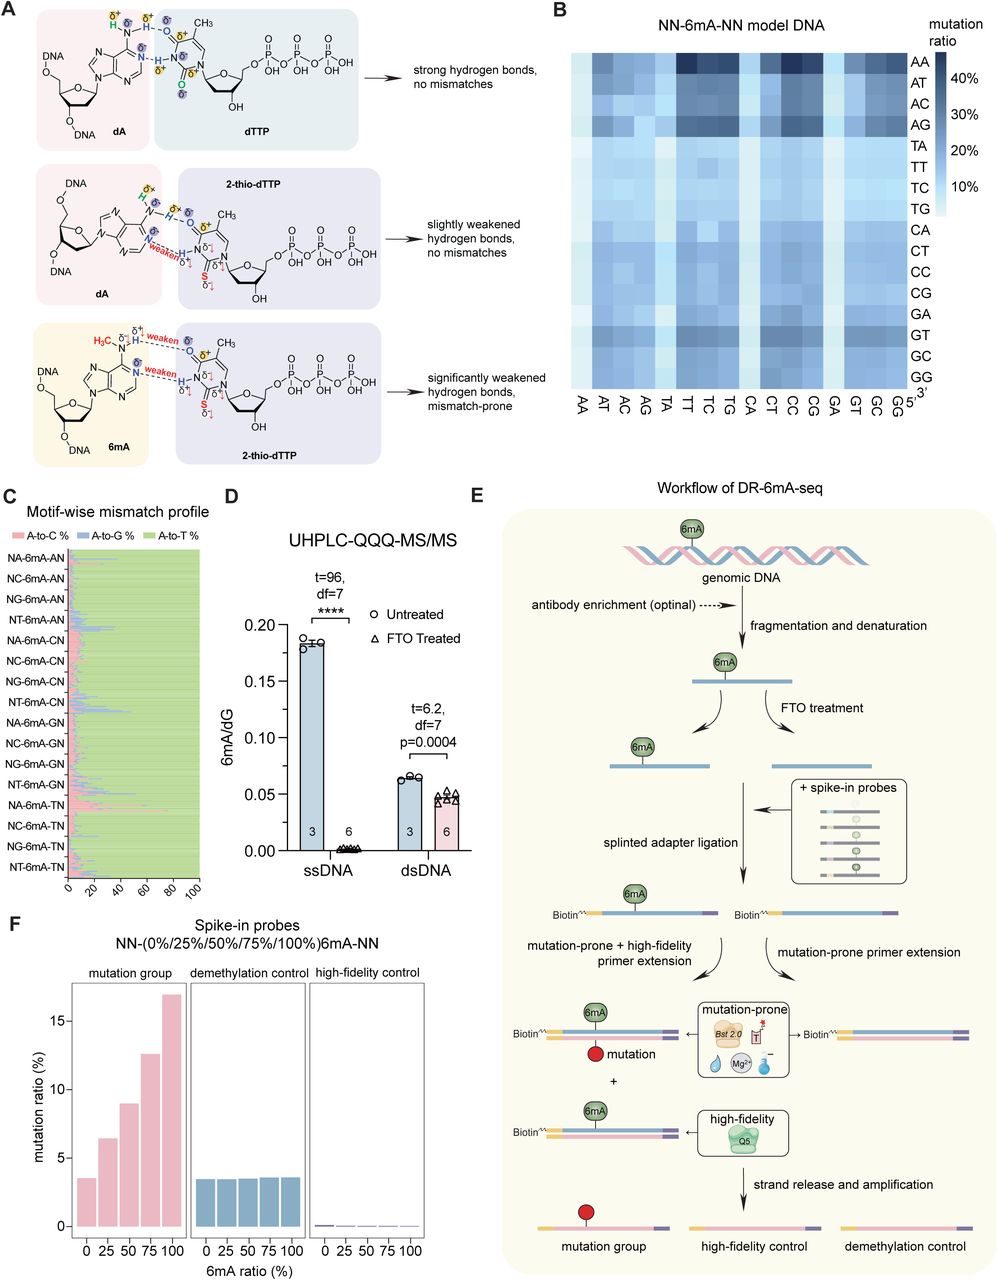 Genomic Dna, supplied by ATCC, used in various techniques. Bioz Stars score: 99/100, based on 1 PubMed citations. ZERO BIAS - scores, article reviews, protocol conditions and more https://www.bioz.com/result/genomic dna/product/ATCC Average 99 stars, based on 1 article reviews
genomic dna - by Bioz Stars,
2026-03
99/100 stars
|
Buy from Supplier |
|
Sino Biological
zika virus envelope protein  Zika Virus Envelope Protein, supplied by Sino Biological, used in various techniques. Bioz Stars score: 92/100, based on 1 PubMed citations. ZERO BIAS - scores, article reviews, protocol conditions and more https://www.bioz.com/result/zika virus envelope protein/product/Sino Biological Average 92 stars, based on 1 article reviews
zika virus envelope protein - by Bioz Stars,
2026-03
92/100 stars
|
Buy from Supplier |
|
ATCC
dmso Dmso, supplied by ATCC, used in various techniques. Bioz Stars score: 96/100, based on 1 PubMed citations. ZERO BIAS - scores, article reviews, protocol conditions and more https://www.bioz.com/result/dmso/product/ATCC Average 96 stars, based on 1 article reviews
dmso - by Bioz Stars,
2026-03
96/100 stars
|
Buy from Supplier |
|
ATCC
vitro test ozone gas standard strains s aureus Vitro Test Ozone Gas Standard Strains S Aureus, supplied by ATCC, used in various techniques. Bioz Stars score: 99/100, based on 1 PubMed citations. ZERO BIAS - scores, article reviews, protocol conditions and more https://www.bioz.com/result/vitro test ozone gas standard strains s aureus/product/ATCC Average 99 stars, based on 1 article reviews
vitro test ozone gas standard strains s aureus - by Bioz Stars,
2026-03
99/100 stars
|
Buy from Supplier |
Image Search Results
Journal: Nature Communications
Article Title: Optically-controlled bacterial metabolite for cancer therapy
doi: 10.1038/s41467-018-03233-9
Figure Lengend Snippet: Characterization of PMT system. a Schematic diagram of the preparation of PMT system. b UV−Vis absorption spectra of as-prepared CCN. c TEM image of CCN@ E. coli . d Spinning disk confocal microscope image of CCN@ E. coli (Blue: CCN; Red: E . coli ). e XPS de-convoluted spectra for the N1s orbitals of E. coli , CCN, and CCN@ E. coli . f XPS de-convoluted spectra for the C1s orbitals of E. coli , CCN and CCN@ E. coli . g Schematic illustration for the photoelectron transport among CCN, electron acceptor and NO generation enzymes
Article Snippet:
Techniques: Microscopy

Journal: Nature Communications
Article Title: Optically-controlled bacterial metabolite for cancer therapy
doi: 10.1038/s41467-018-03233-9
Figure Lengend Snippet: In vitro study of PMT system. a Griess method for quantitative determining the NO generation of CCN@ E. coli , E. coli (10 9 CFU, 2 mL), and CCN. b Electrochemical method for monitoring the cumulative NO in the gas phase produced by CCN@ E. coli after 15 min of irradiation (10 11 CFU, 5 mL). c Transient photocurrent responses of CCN. d Intracellular NADH level of wide-type E. coli , CCN@ E. coli with or without light irradiation. e 15 N-NMR for monitoring the in situ CCN@ E . coli NO 3 − metabolism with or without light irradiation. The chemical shift of 15 N-pyridine in neutral media was defined as 0 ppm. f Luminol chemiluminiscence assay for qualitative determining NO generation of CCN@ E. coli , E. coli and CCN. g Schematic illustration for the optically controlled NO metabolism close loop. h Schematic diagram of the 3D-printing co-culture system. i Images from the co-culture system time series sequentially observing CCN@ E. coli movement and NO generation (Scale bar: 2 μm for the first row and 100 μm for the second row). j Flow cytometry for measuring the intracellular NO concentration of 4T1 cells after various treatment. k Cell viability of 4T1 cells co-cultured with CCN@ E. coli . l Cell viability of 4T1 cells co-cultured with CCN@ E. coli after 3-MA (3-Methyladenine, autophagy inhibitor), Fer-1 (ferrostatin-1, ferroptosis inhibitor), Nec-1 (Necrostatin-1, necroptosis inhibitor), Ac-DEVD-CHO (apoptosis inhibitor), hemoglobin treatment (NO scavenger), glutathione (GSH, ROS trapper), sodium ascorbate (VC, ROS trapper). Significance between every two groups was calculated using unpaired two-tailed Student’s t -test unless otherwise indicated. * P < 0.05, ** P < 0.01, *** P < 0.001. The mean values and S.D. are presented. Data of panels a , b , d , f , j , k , and l are from >4 biological replicates per sample
Article Snippet:
Techniques: In Vitro, Produced, Irradiation, In Situ, Co-Culture Assay, Flow Cytometry, Concentration Assay, Cell Culture, Two Tailed Test

Journal: Nature Communications
Article Title: Optically-controlled bacterial metabolite for cancer therapy
doi: 10.1038/s41467-018-03233-9
Figure Lengend Snippet: In vivo bio-distribution and bio-compatibility of PMT system. a In vivo fluorescence imaging of tumor-targeting ability of CCN@ E. coli . The imaging was performed at different time points after the i.v. injection of CCN@ E. coli (10 8 CFU mL −1 in 200 μL saline, n = 5). b Ex vivo fluorescence imaging for investigating the bio-distribution of CCN@ E. coli (Scale bar: 100 μm). c Tumor accumulation of E. coli and CCN@ E. coli . d Transverse sections of CCN@ E. coli treated tumor after targeting and penetrating (Scale bar: 100 μm). The experiment was performed at 24 h after the i.v. injection of CCN@ E. coli (10 8 CFU mL −1 in 200 μL saline, n = 3). e Images of whole mouse tumor and CLARITY technique treated optically transparent tumor. The experiment was performed at 24 h after the i.v. injection of CCN@ E. coli (10 8 CFU mL −1 in 200 μL saline). f Three-dimensional fluorescence imaging for visualizing the co-localization of CCN@ E. coli and hypoxic region within the tumor. g In vitro hypoxia-induced chemotaxis of CCN@ E. coli . h PCR analysis of CCN@ E. coli within liver, spleen, and kidney decreased with the time prolonging. The PCR analysis was performed on the 1st, 7th, 14th, and 21th days after the i.v. injection of CCN@ E. coli (10 8 CFU mL in 200 μL saline, n = 10). The mean values and S.D. are presented. i Blood biochemistry and hematologic indexes of mice after i.v. injection with CCN@ E. coli . The experiment was performed on the 1st and 7th days after the i.v. injection of CCN@ E. coli (10 8 CFU mL −1 in 200 μL saline, n = 3)
Article Snippet:
Techniques: In Vivo, Fluorescence, Imaging, Injection, Saline, Ex Vivo, In Vitro, Chemotaxis Assay

Journal: Nature Communications
Article Title: Optically-controlled bacterial metabolite for cancer therapy
doi: 10.1038/s41467-018-03233-9
Figure Lengend Snippet: In vivo NO generation and anti-cancer effect of PMT system. a Schematic illustration of the NO responsive element contained sensing plasmid and its in vitro NO responsiveness ( n = 3). b In vivo NO generation of PMT system in 4T1 Nrf2-luc tumor-bearing mice. The imaging was performed 24 h after the i.v. injection of E. coli , CCN@ E. coli (10 8 CFU mL −1 in 200 μL saline), and CCN (5 mg mL −1 in 200 μL saline). c MRI images for detecting both in vitro and in vivo NO generation with the assistance of NO responsive contrast agent Fe-MGD ( n = 3). The in vivo imaging was performed 24 h after the i.v. injection of CCN@ E. coli (10 8 CFU mL −1 in 200 μL saline). d Imaging apoptotic response in vivo with annexin V-Cy5.5 (Red: CCN@ E. coli , Green: apoptotic cancer cells). The in vivo imaging was performed 48 h after the i.v. injection of CCN@ E. coli (10 8 CFU mL −1 in 200 μL saline). e Semiquantitative analysis of relationship among intratumoral NO concentration (evaluated by the circle area), bacteria count, and signal intensity of apoptotic cells ( n = 3). f Schematic diagram of the process of in vivo anti-cancer therapy. Intravenous injection of E. coli , CCN@ E. coli (10 8 CFU mL −1 in 200 μL saline), CCN (5 mg mL −1 in 200 μL saline) and phosphate buffer solution treated group (PBS) were performed on the 1st and 7th days ( n = 6). Light irradiation was performed 24 h after the injection ( > 630 nm, 30 mW cm −2 , 15 min). g In vivo anti-cancer effect of PMT in 4T1 tumor-bearing mice ( n = 6). h In vivo anti-cancer effect of PMT in CT26 tumor-bearing mice ( n = 6). i H&E staining of 4T1 tumor after 14 days of PMT (Scale bar: 100 μm). j TUNEL staining of 4T1 tumor after 14 days of PMT (Scale bar: 100 μm). k Three-dimensional fluorescence imaging for visualizing the co-localization of CCN@ E. coli and apoptotic region within the tumor. Significance between every two groups was calculated using unpaired two-tailed Student’s t -test. * P < 0.05, ** P < 0.01, *** P < 0.001. The mean values and S.D. are presented
Article Snippet:
Techniques: In Vivo, Plasmid Preparation, In Vitro, Imaging, Injection, Saline, In Vivo Imaging, Concentration Assay, Bacteria, Irradiation, Staining, TUNEL Assay, Fluorescence, Two Tailed Test

Journal: Nature Communications
Article Title: Optically-controlled bacterial metabolite for cancer therapy
doi: 10.1038/s41467-018-03233-9
Figure Lengend Snippet: Isobaric tags for relative and absolute quantitation proteomics study for exploring the anti-cancer mechanism of PMT system. a Heat map showing significantly upregulated and downregulated proteins (fold change ≥ 1.5 and P < 0.05). b Biological functions, cellular component, and molecular functions of differential proteins based on GO annotation. c Venn diagram indicated the non-overlapped biological effect of E. coli and NO generated from PMT system. Histograms of differential proteins associated with E. coli infection, bacteria invasion, DNA damage, and oxidative stress based on GO annotation. d Functional interaction network of PMT regulated proteins was analyzed by using Search Tool for the Retrieval of Interacting Genes/Proteins (STRING) algorithm. e KEGG pathway analysis for antigen processing and presentation associated differential proteins (upregulation proteins were marked with a red box). f Flow cytometry for evaluating the DC maturation. g – i Dead-cell proximity index and Euclidean distance matrix analysis index of CD-86/caspase-3 after PBS or CCN@ E. coli treatment ( n = 6, scale bar: 50 μm). j Serum IL-1β, TNF-α, IFN-γ, and IL-6 level after PBS, CCN, E. coli , or CCN@ E. coli treatment ( n = 6). Significance between every two groups was calculated using unpaired two-tailed Student’s t -test. * P < 0.05, ** P < 0.01, *** P < 0.001. Data are mean ± S.D. ( j ) or median ( h , i ) linked with individual values
Article Snippet:
Techniques: Quantitation Assay, Generated, Infection, Bacteria, Functional Assay, Flow Cytometry, Two Tailed Test
Journal: Scientific Reports
Article Title: Virulence and transcriptome profile of multidrug-resistant Escherichia coli from chicken
doi: 10.1038/s41598-017-07798-1
Figure Lengend Snippet: MICs (µg/mL) of five MDR E. coli isolates.
Article Snippet: In order to identify the molecular mechanism of virulent regulators in MDR E. coli , further transcriptome analysis of the most significant strain, E. coli 381, was performed and compared to the transcriptome profile of
Techniques:

Journal: Scientific Reports
Article Title: Virulence and transcriptome profile of multidrug-resistant Escherichia coli from chicken
doi: 10.1038/s41598-017-07798-1
Figure Lengend Snippet: Selected clinical isolates of poultry E. coli producing resistant genes.
Article Snippet: In order to identify the molecular mechanism of virulent regulators in MDR E. coli , further transcriptome analysis of the most significant strain, E. coli 381, was performed and compared to the transcriptome profile of
Techniques:

Journal: Scientific Reports
Article Title: Virulence and transcriptome profile of multidrug-resistant Escherichia coli from chicken
doi: 10.1038/s41598-017-07798-1
Figure Lengend Snippet: Biofilm formation of five isolates of E. coli and reference strain at different time intervals. The results are shown in the form of mean biofilm formation index (BFI) of three independent repeats and compared to E. coli ATCC 25922. Statistical significance (P ≤ 0.05) was calculated using two-tailed t-test. *P- values of ≤ 0.05 was considered significant higher than control. # P values of ≤0.05 was considered significant lower than control. **P- values of ≤0.05 was considered significant higher than control and *.
Article Snippet: In order to identify the molecular mechanism of virulent regulators in MDR E. coli , further transcriptome analysis of the most significant strain, E. coli 381, was performed and compared to the transcriptome profile of
Techniques: Two Tailed Test, Control

Journal: Scientific Reports
Article Title: Virulence and transcriptome profile of multidrug-resistant Escherichia coli from chicken
doi: 10.1038/s41598-017-07798-1
Figure Lengend Snippet: In vitro virulence assay of five E. coli isolates along with ATCC 25922 in Caco-2 cells. ( a ) Number of adherent and internalized bacteria. The results are presented as log10 of the mean ± standard deviation (SD) CFU/mL of three independent repeats and compared to E. coli ATCC 25922. ( b ) Intracellular survival rate of E. coli isolates at different time intervals. The results are presented as log10 CFU/mL mean ± SD of survival rate. Asterisk (*) represents statistical significance (P ≤ 0.05) using two-tailed t-test.
Article Snippet: In order to identify the molecular mechanism of virulent regulators in MDR E. coli , further transcriptome analysis of the most significant strain, E. coli 381, was performed and compared to the transcriptome profile of
Techniques: In Vitro, Bacteria, Standard Deviation, Two Tailed Test

Journal: Scientific Reports
Article Title: Virulence and transcriptome profile of multidrug-resistant Escherichia coli from chicken
doi: 10.1038/s41598-017-07798-1
Figure Lengend Snippet: In vitro virulence assay of five E. coli isolates along with ATCC 25922 in macrophage RAW 264.7 cells. ( a ) Number of adherent and internalized bacteria. The results are presented as log10 of the mean ± standard deviation (SD) CFU/mL of three independent repeats and compared to E. coli ATCC 25922. ( b ) Intracellular survival rate of E. coli isolates at different time intervals. The results are presented as log10 CFU/mL mean ± SD of survival rate. Asterisk (*) represents statistical significance (P ≤ 0.05) using two-tailed t-test.
Article Snippet: In order to identify the molecular mechanism of virulent regulators in MDR E. coli , further transcriptome analysis of the most significant strain, E. coli 381, was performed and compared to the transcriptome profile of
Techniques: In Vitro, Bacteria, Standard Deviation, Two Tailed Test

Journal: Scientific Reports
Article Title: Virulence and transcriptome profile of multidrug-resistant Escherichia coli from chicken
doi: 10.1038/s41598-017-07798-1
Figure Lengend Snippet: Determination of LD50 of the three multidrug resistant E. coli isolates in two-day old chickens.
Article Snippet: In order to identify the molecular mechanism of virulent regulators in MDR E. coli , further transcriptome analysis of the most significant strain, E. coli 381, was performed and compared to the transcriptome profile of
Techniques:

Journal: Scientific Reports
Article Title: Virulence and transcriptome profile of multidrug-resistant Escherichia coli from chicken
doi: 10.1038/s41598-017-07798-1
Figure Lengend Snippet: Important up-regulated and dwown-regulated genes in E. coli 381.
Article Snippet: In order to identify the molecular mechanism of virulent regulators in MDR E. coli , further transcriptome analysis of the most significant strain, E. coli 381, was performed and compared to the transcriptome profile of
Techniques: Conjugation Assay, Membrane, Binding Assay, Activation Assay, Chemotaxis Assay

Journal: Scientific Reports
Article Title: Virulence and transcriptome profile of multidrug-resistant Escherichia coli from chicken
doi: 10.1038/s41598-017-07798-1
Figure Lengend Snippet: Proposed resistance ( a ) and virulence ( b ) regulating genes and associated factors in isolate E. coli 381. Up-regulated genes and factors are shown with red-colored upward arrows while down-regulated genes and factors are shown with green-colored downward arrows.
Article Snippet: In order to identify the molecular mechanism of virulent regulators in MDR E. coli , further transcriptome analysis of the most significant strain, E. coli 381, was performed and compared to the transcriptome profile of
Techniques:
Journal: Cell stem cell
Article Title: Glucose modulates IRF6 transcription factor dimerization to enable epidermal differentiation.
doi: 10.1016/j.stem.2025.02.017
Figure Lengend Snippet: Figure 1. Intracellular glucose accumulates in keratinocyte differentiation (A) Heatmap representing average fold change of 614 metabolites identified in metabolomics, in early (day 3) and late (day 6) differentiation compared with the undifferentiated state (n = 5 biological replicates). (B) Accumulation of 2-NBDG (green), a fluorescent glucose analog, in differentiated keratinocytes with Hoechst nuclear stain (blue). Progenitor (PG) represents undifferentiated cells versus days 3 and 6 of calcium-induced differentiation in vitro (representative image of 3 independent samples, scale bar, 10 mm). (C and D) Quantitation of glucose-14C (C6) (C) or glucose-14C (C1) (D) accumulation during differentiation in culture, after 7 day incubation, normalized to mg of protein per sample (n = 3 biological replicates, 3 technical replicates per experiment). (E) Quantitation of glucose concentrations in regenerated epidermal organoid tissue, and whole epidermis undergoing stratification through day 6 analyzed (n = 3 biological replicates). (F) Epidermal organoids expressing vector control or the Red Glifon 3000 glucose sensor, and the dsRed signal (red) indicates detection of free glucose, with nuclear DAPI (blue) and phalloidin (green) stains (representative image of 3 biological replicates, scale bar, 50 mm). (G) Quantitation of dsRed intensity in the basal and spinous layers of the tissue normalized to phalloidin (n = 8 fields of view across 2 biological replicates). (H) Epidermis from transgenic mice expressing Red Glifon 3000; detection of free glucose (red), nuclear DAPI stain (blue), and immunostaining of differentiation marker keratin 10 (green); and gray bar indicates region of interest (ROI) used for quantitation in (I) (representative image shown, n = 3 biological replicates, scale bar, 50 mm). (I) Average fluorescence intensity with standard error (shaded region) in the ROI of Red Glifon, DAPI, and K10 across the epidermis from the basal layer up to but excluding the stratum corneum (n = 6). Data are represented as mean ± SEM, two-tailed unpaired Student’s t test was used for statistical analysis, *p < 0.05, ****p < 0.001. See also Figure S1 and Table S1.
Article Snippet: The iGlucoSnFR sensor (a gift from J. Keller and L. Looger, Addgene plasmid # 164514) and
Techniques: Staining, In Vitro, Quantitation Assay, Incubation, Expressing, Plasmid Preparation, Control, Transgenic Assay, Immunostaining, Marker, Two Tailed Test
Journal: Nature Communications
Article Title: Efficacy of modified-vaccinia Ankara vaccine as pre- and post-exposure prophylaxis against monkeypox sexual transmission in non-human primate model
doi: 10.1038/s41467-025-62681-2
Figure Lengend Snippet: Four cynomolgus macaques were challenged with MPXV IIb virus on day 0 with 1 × 10 7 pfu of MPXV by the rectal route. Two animals were euthanized on day 11 and two were followed for 83 days for clinical and immunological monitoring ( a ). Five clinical signs were monitored for 34 days ( n = 2): the presence of rectal exudate, loss of appetite, presence of lesions, lymphadenomegaly, and weight loss >10% were recorded for each animal. b Viral load assessment in rectal and seminal fluids ( n = 4 for rectal fluid and n = 2 for seminal plasma). MPXV DNA was quantified by qPCR and is expressed as viral DNA copies/mL. The lower limit of detection (LLOD) was 90,000 copies/mL, and the lower limit of quantification (LLOQ) was 100,000 copies/mL. c The rectal and seminal fluid samples containing viral DNA were tested for virus infectivity in Vero cells. Viral infectivity is quantified in pfu/mL. The LLOD was established at 10 PFU/mL, indicated by the dotted line. All samples below this LLOD were considered negative and are represented by a value of 1. d Orthopoxvirus-binding IgG concentrations are reported in arbitrary units (arb. unit./mL). Serum (left) and seminal plasma (right) from two NHPs ( n = 2) were evaluated for the total anti-MPXV protein IgG concentration before challenge and at various time points up to days 62 and 83 post-challenge for serum and seminal plasma, respectively. Each symbol represents one animal, and the different shapes represent different antigens. The dashes represent the mean. Ag: antigen. Source data are provided as a Source Data file.
Article Snippet:
Techniques: Virus, Clinical Proteomics, Infection, Binding Assay, Concentration Assay

Journal: Nature Communications
Article Title: Efficacy of modified-vaccinia Ankara vaccine as pre- and post-exposure prophylaxis against monkeypox sexual transmission in non-human primate model
doi: 10.1038/s41467-025-62681-2
Figure Lengend Snippet: Representative Hematoxylin-Eosin staining of the rectal mucosa on day 11 post-challenge from a cynomolgus macaque infected with MPXV. The analysis was performed on 2 animals. a Ulcerated rectal mucosa at the margin of the anus showing ulcerative, necrotizing rectitis (*) characterized by b hyperplastic mucosa (arrowhead) and c fibrin and extravasated erythrocytes (hemorrhage) (arrow head). d rectal submucosa, with numerous inflammatory cells (arrow head), mostly e neutrophils (calprotectin staining), f T cells (CD3 staining), g follicular-like B-cell aggregates (CD20 staining), and h minimal diffuse macrophage infiltration (CD68 staining). i RNA scope using a specific MPXV probe in the submucosal ulcerated tissue and adjacent epithelium (purple staining localized mostly in the ulcerated area). j RNAscope with the negative control probe DapB. Scale-bars: a = 500 µm, b – j = 100 µm.
Article Snippet:
Techniques: Staining, Infection, RNAscope, Negative Control

Journal: Nature Communications
Article Title: Efficacy of modified-vaccinia Ankara vaccine as pre- and post-exposure prophylaxis against monkeypox sexual transmission in non-human primate model
doi: 10.1038/s41467-025-62681-2
Figure Lengend Snippet: a Study design on NHP immunization and challenge periods in weeks, and a description of the four groups of cynomolgus macaques. One group was vaccinated before the challenge with two doses of MVA administered 4 weeks apart (MVA-PrEP, n = 4; gray). Another group was vaccinated with a single dose four days after the MPXV IIb challenge (MVA-PEP, n = 4; black). In addition, we challenged one group of convalescent NHPs previously exposed via the rectal or ID route alone or in combination 37–46 weeks before the challenge and described previously (Conv., n = 6; orange) and one control group (CTRL, n = 4; red). The four groups were challenged with 1 × 10 7 pfu of MPXV by the rectal route as indicated in blue. MVA-PrEP animals were monitored during the MVA immunization phase, with blood samplings for immunogenicity analysis. Following the MPXV challenge, blood, rectal fluid, seminal plasma, and skin swab samples were collected. The blue vertical dotted line represents the challenge. The image was created in BioRender. Herate, C. (2025) https://BioRender.com/lkzvios . b Rectal fluids collected during the challenge phase were evaluated for viral DNA content by qPCR. Viral load is expressed as viral DNA copies/mL. Each graph represents the viral kinetics of one group during 27 days. The LLOD was 36,000 copies/mL and the LLOQ 100,000 copies/mL. c Rectal fluid containing viral DNA was tested for virus infectivity in Vero cells and measured in pfu/mL. The LLOD was established at 10 PFU/mL, indicated by the dotted line. All samples below the LLOD were considered negative and are represented by a value of 1. When qPCR was negative, samples were considered negative and are represented by a value of 1. d Area under the curve (AUC) of viral DNA in rectal fluids during the 27 days of follow-up and statistical analysis. (CTRL, n = 4; red), (MVA-PEP, n = 4; black) (MVA-PrEP, n = 4; gray) (Conv., n = 6; orange). **: p = 0.0079. Each circle represents one animal. e Viral load measured by qPCR in skin swabs (left) and seminal plasma (right) sampled at day 11 and statistical analysis. The mean value is represented by the horizontal bar. (CTRL, n = 4 for skin and seminal fluid; red), (MVA-PEP, n = 3 for skin and n = 4 for seminal fluid; black) (MVA-PrEP, n = 3 for skin and n = 4 for seminal fluid; gray) (Conv., n = 5 for skin and n = 6 for seminal fluid; orange). *: p = 0.0333. Each circle represents one animal. Statistical analyses were performed using the Kruskal-Wallis test followed by a two-tailed non-parametric Mann-Whitney test (* p < 0.05, ** p < 0.01). Source data are provided as a Source Data file.
Article Snippet:
Techniques: Control, Immunopeptidomics, Clinical Proteomics, Virus, Infection, Two Tailed Test, MANN-WHITNEY

Journal: Nature Communications
Article Title: Efficacy of modified-vaccinia Ankara vaccine as pre- and post-exposure prophylaxis against monkeypox sexual transmission in non-human primate model
doi: 10.1038/s41467-025-62681-2
Figure Lengend Snippet: a The concentrations of five MPXV (upper panel) and homologous VACV (lower panel) protein-binding IgG were quantified in the serum of NHPs that were either immunized with MVA and/or challenged with MPXV. The data are expressed in arbitrary units (arb. unit./mL). Total IgG concentrations in NHP serum were monitored during the immunization phase for the MVA-PrEP group and after the challenge phase. For the remaining three groups, IgG follow-up began two weeks prior to the challenge. b Seroneutralization titers were measured in the serum collected at week -1 and week 4 post-challenge using Vero cells and live MPXV or VACV. The mean PRNT50 with standard deviation were calculated using infectious MPXV IIb (left panel): *: p = 0.0159, MPXV Ia (middle panel): *: p = 0.0159 or VACV-107 (right panel): *: p = 0.0190 and **: p = 0.0095. (CTRL, n = 4; red), (MVA-PEP, n = 4; black), (MVA-PrEP, n = 4; gray), (Conv., n = 6 at W-1 and n = 5 at W4; orange). c , d Cellular immunity conferred by MVA vaccination and/or MPXV challenge. (CTRL, n = 4; red), (MVA-PEP, n = 4; black) (MVA-PrEP, n = 4; gray) (Conv., n = 6 and n = 5 from W14; orange). Intracellular staining of PBMCs, collected during the MVA immunization phase and after MPXV challenge, after an overnight MPXV or MVA stimulation in vitro. Panels represent the mean percentage with standard deviation of CD4 + CD154 + cells expressing IFN-γ ( c ) and IL17A ( d ) upon MPXV 2b (left) or MVA (right) stimulation. For ( b – d ), each circle represents one animal. When represented, statistical analyses were performed using the Kruskal-Wallis test followed by a two-tailed non-parametric Mann-Whitney test (* p < 0.05, ** p < 0.01). Ag: antigen; Stim. Stimulation. Source data are provided as a Source Data file.
Article Snippet:
Techniques: Protein Binding, Standard Deviation, Staining, In Vitro, Expressing, Two Tailed Test, MANN-WHITNEY

Journal: Nature Communications
Article Title: Efficacy of modified-vaccinia Ankara vaccine as pre- and post-exposure prophylaxis against monkeypox sexual transmission in non-human primate model
doi: 10.1038/s41467-025-62681-2
Figure Lengend Snippet: CD4+ and CD8+ cells producing TNF-α, IL-2, and IFN-γ are represented for each animal (one pie chart per animal) at W12 post-immunization (W−1 post-challenge) and W15 post-immunization (W2 post-challenge). The polyfunctionality of CD4 + CD154 + (left) and CD8 + CD137 + (right) cells upon MPXV IIb stimulation is shown. Non-responder cells are not represented. Cells secreting only one of the three cytokines are in blue, two of them in green, and three in orange. Source data are provided as a Source Data file.
Article Snippet:
Techniques:

Journal: Nature Communications
Article Title: Efficacy of modified-vaccinia Ankara vaccine as pre- and post-exposure prophylaxis against monkeypox sexual transmission in non-human primate model
doi: 10.1038/s41467-025-62681-2
Figure Lengend Snippet: Correlation matrix between virological parameters measured after the MPXV challenge and humoral and cellular parameters measured 1 week before the challenge. Spearman's r values from −0.7 to −1 and from 0.7 to 1 are shown. Fl.: fluid.
Article Snippet:
Techniques:
Journal: Gut Microbes
Article Title: The Mucosally-Adherent Rectal Microbiota Contains Features Unique to Alcohol-Related Cirrhosis
doi: 10.1080/19490976.2021.1987781
Figure Lengend Snippet: Beta-diversity of EtOH vs non-EtOH cirrhosis with linear model of taxonomic changes. (a) Principal Coordinates Analysis via Bray–Curtis distances of rectal swabs by EtOH vs. non-EtOH etiology of cirrhosis ( p = .19; R 2 = 0.03). (b) Principal Coordinates Analysis via Bray–Curtis distances of stool by EtOH vs. non-EtOH etiology of cirrhosis ( p = .31; R 2 = 0.03). (c) Relative abundances of E. coli and Enterobacteriaceae in rectal swabs of EtOH vs. non-EtOH cirrhosis (FDR < 0.05). Gray dotted line indicates separation of high and low E. coli /Enterobacteriaceae groups
Article Snippet: To test this hypothesis, we incubated
Techniques:

Journal: Gut Microbes
Article Title: The Mucosally-Adherent Rectal Microbiota Contains Features Unique to Alcohol-Related Cirrhosis
doi: 10.1080/19490976.2021.1987781
Figure Lengend Snippet: E. coli growth in vitro under physiological concentrations of ethanol after alcohol consumption and its oxidative metabolites at pH 6. Growth curve in LB (aerobic, 37°C) with (a) ethanol, (b) acetaldehyde, (c) acetate, and (d) ethanol, acetaldehyde, and acetate alone and in combination. Data expressed as mean ± SEM. N = 3 replicates per condition
Article Snippet: To test this hypothesis, we incubated
Techniques: In Vitro
 Fig. S2 A . In dark gray , P. aeruginosa SG17M specific tLST genes; light gray , additional tLST genes present in other tLST classes. C , molecular weight determination of PaFtsH1 and PaFtsH2 purified from Escherichia coli . Purified PaFtsH1 and PaFtsH2 were run on an analytical Superdex 200 3.2/3.0 gel filtration column ( left ) and separated by a 4 to 20% gradient SDS-PAGE in a two-fold dilution series (insets). Molecular weights of PaFtsH enzymes were consistent with hexamer formation plus ∼3.5 NP-40 micelles per PaFtsH1-6xHis hexamer (PaFtsH1 6 -6xHis: 743,373 Da; one NP-40 micelle: ∼90 Da) and ∼2.7 NP-40 micelles per PaFtsH2-6xHis hexamer (PaFtsH2-6xHis: 659,792 Da). Theoretical molecular weights of 6xHis-tagged PaFtsH monomers: PaFtsH1-6xHis: 70,886 Da; PaFtsH2-6xHis: 69,521 Da. D , hydrolysis of ATP (5 mM) by PaFtsH1 ( blue bars) or PaFtsH2 ( purple bars) (0.43 μM) in the presence or absence of the substrate β-casein (40 μM) at 40 °C. ATP hydrolysis rates by PaFtsH1 and PaFtsH2 increased in the presence of β-casein (two-tailed Mann-Whitney U test (∗ p < 0.05)). The rate of ATP hydrolysis by β-casein in the absence of enzyme was negligible (0.0032 ± 0.0004 ATP min −1 ). E , Forty micromolar β-casein was incubated at 40 °C with PaFtsH1 or PaFtsH2 (0.43 μM), and degradation kinetics were monitored by a 4 to 20% gradient SDS-PAGE. Data points are averages of three independent replicates ± SD ( bottom ). M: Molecular weight marker taken from the PaFtsH2 casein degradation gel. F , the N-terminal domain of phage λ repressor (λcI N ) with a C-terminal ssrA degron tag (λcI N -ssrA; 15 μM) was incubated at 40 °C with EcFtsH, PaFtsH1, or PaFtsH2 (3.04 μM). λcI N -ssrA PDB: 1LM . M: Molecular weight marker. G , SsrA degron-tagged Arc repressor-(6 x H)KNQHE (Arc-st11-ssrA; 15 μM) was incubated at 40 °C with EcFtsH, PaFtsH1, or PaFtsH2 (3.53 μM). Arc-st11-ssrA PDB: 1ARR . M: Molecular weight marker. D – G , all reactions used C-terminal 6xHis-tagged proteins. E - G , all reactions contained 5 mM ATP and a creatine kinase (CK)-based ATP regeneration system . DNTR, diverse N-terminal region; MC, membrane-cytoplasmic; MC 7+ , membrane-cytoplasmic linker plus seven C-terminal amino acids into the AAA+ ATPase module boundary; MW, Molecular weight; M, Molecular weight marker; mAU, milli-Absorbance Unit; MC 7+ , membrane-cytoplasmic plus next seven C-terminal amino acids; Peri, periplasmic domain; TM1, transmembrane helix 1; TM2, transmembrane helix 2. " width="100%" height="100%">
Journal: The Journal of Biological Chemistry
Article Title: The membrane-cytoplasmic linker defines activity of FtsH proteases in Pseudomonas aeruginosa clone C
doi: 10.1016/j.jbc.2023.105622
Figure Lengend Snippet: Purified hex americ PaFtsH1 and PaFtsH2 have distinct biochemical activities in vitro . A , schematic ( top ) and linear representation ( bottom ) of a prototypical hexameric FtsH enzyme in a bacterial cell with key regions labeled. The DNTR spans the N-terminus, TM1, periplasmic domain, TM2, MC linker, and the first seven amino acids in the AAA+ ATPase module (MC 7+ ). B , schematic of genetic loci of PaftsH genes in Pseudomonas aeruginosa SG17M clone C strain. PaFtsH1 is encoded on the core genome of SG17M ( blue ), and PaFtsH2 ( purple ) is encoded on a horizontally acquired genomic island termed the transmissible locus of stress tolerance (tLST) which is distinctive in SG17M clone C. Names of genes in the vicinity of ftsH1 and ftsH2 are labeled in
Article Snippet: For protein induction, EcFtsH-Myc-6xHis, PaFtsH1-6xHis, and PaFtsH2-6xHis variants were expressed from a pET-28a(+) plasmid in
Techniques: Purification, In Vitro, Labeling, Molecular Weight, Filtration, SDS Page, Two Tailed Test, MANN-WHITNEY, Incubation, Marker, Membrane
 Table S1 . Circled spots indicate peptides containing residues A132 and/or K135, which were previously shown to be important for in vivo Escherichia coli FtsH (EcFtsH) binding to RpoH (conserved RpoH residues from E. coli are A131 and K134; ( , )). B , amino acid sequence of PaRpoH ( top ). Residues in red indicate regions bound by 35 S-EcFtsH, 35 S-PaFtsH1, 35 S-PaFtsH2. Residues in blue correspond to A132 and K135 (see panel A legend). FtsH-bound sequences identified by peptide blotting are mapped on the predicted PaRpoH structure ( bottom ; ) and numbered as on the sequence above. C , colony sizes of wild-type P. aeruginosa SG17M, the SG17M Δ ftsH1 Δ ftsH2 double deletion and SG17M Δ ftsH1 Δ ftsH2 strains complemented with either an empty pJN105 expression vector (EV) or pJN105-derived expression of PaFtsH1 or PaFtsH2. Pa ftsH1 and Pa ftsH2 genes had been cloned into the expression vector pJN105 under the translational regulation of the Pa ftsH2 Shine Dalgarno (SD) sequence. “+” and “-” scoring system relates the qualitative degree of colony growth of a particular strain genotype relative to that of SG17M EV (++++; wild-type colony growth) or SG17M Δ ftsH1 Δ ftsH2 (-; very poor colony growth). For ( C and E ), numbers along the top refer to the serial dilution factor for plating cells. D , schematic representation of PaFtsH1 and PaFtsH2 hybrid protein constructs. Regions corresponding to PaFtsH1 and PaFtsH2 identity are depicted in gray and purple , respectively ( top ). Designation of protein variants and regions derived from PaFtsH1 and/or PaFtsH2 that make up the respective FtsH hybrid variants are indicated in the table ( bottom ). E , colony size of the P. aeruginosa SG17M Δ ftsH1 Δ ftsH2 double deletion strain complemented with Pa ftsH1 and Pa ftsH2 hybrid constructs as introduced in panel D . “+” and “-” scoring system is the same as in ( C ). DNTR, Diverse N-terminal region; MC 7+ , membrane-cytoplasmic linker plus seven C-terminal amino acids into the AAA+ ATPase module boundary; TM1, Transmembrane helix 1; TM2, Transmembrane helix 2. " width="100%" height="100%">
Journal: The Journal of Biological Chemistry
Article Title: The membrane-cytoplasmic linker defines activity of FtsH proteases in Pseudomonas aeruginosa clone C
doi: 10.1016/j.jbc.2023.105622
Figure Lengend Snippet: PaFtsH1 and PaFtsH2 have similar in vitro peptide-binding profiles and differentially affect in vivo colony size. A , peptide array of the RpoH sequence from Pseudomonas aeruginosa (PaRpoH; P42378|RpoH_PSEAE; 1–284, sliding window of 12 amino acids with a step size of two amino acids towards the C-terminus with each spot) probed with 1 μM 35 S-EcFtsH ( top ), 35 S-PaFtsH1 ( middle ), or 35 S-PaFtsH2 ( bottom ) in the presence of 1.25 mM ATPγS. Peptide sequences corresponding to each spot are listed in
Article Snippet: For protein induction, EcFtsH-Myc-6xHis, PaFtsH1-6xHis, and PaFtsH2-6xHis variants were expressed from a pET-28a(+) plasmid in
Techniques: In Vitro, Binding Assay, In Vivo, Peptide Microarray, Sequencing, Expressing, Plasmid Preparation, Derivative Assay, Clone Assay, Serial Dilution, Construct, Membrane
Journal: Nature Communications
Article Title: Cyclophilin J limits inflammation through the blockage of ubiquitin chain sensing
doi: 10.1038/s41467-018-06756-3
Figure Lengend Snippet: The C-terminal of CYPJ interacts with TAB2 and TAB3. a Effects of CYPJ on NF-κB reporter activation induced by individually transfected components of the NF-κB signal pathway ( N = 3). b , c Reciprocal co-IP assays determine the interaction between HA-CYPJ and Flag-TAB2 or Flag-TAB3 in 293T cells. d Endogenous co-IP assays evaluate the interaction between CYPJ and TAB2/TAB3 with or without TNF treatment for different time points in 293T cells. e Immunofluorescence microscopy observing the colocalization of pEGFP-CYPJ and Flag-TAB2 in HeLa cells. Scale bars, 20 μm. f Multiple sequence alignments of CYPJ proteins from different species. The three fragments of CYPJ are marked. g GST pull-down assays were performed using E.coli -expressed GST and GST-CYPJ fragments and lysates of 293T cells transfected with Flag-TAB2 or Flag-TAB3. h Co-IP assays detecting the interaction between Flag-TAB2/3 with HA-tagged FL or fragment-3 deleted CYPJ, # indicates a nonspecific band. Error bars indicate S.D.; n.s. no significance, * p < 0.05, ** p < 0.01 (two-tailed Student’s t -test)
Article Snippet: GST and GST fusion proteins were expressed and purified from
Techniques: Activation Assay, Transfection, Co-Immunoprecipitation Assay, Immunofluorescence, Microscopy, Sequencing, Two Tailed Test

Journal: Nature Communications
Article Title: Cyclophilin J limits inflammation through the blockage of ubiquitin chain sensing
doi: 10.1038/s41467-018-06756-3
Figure Lengend Snippet: CYPJ binds to the NZF domain of TAB2 and TAB3. a Schematic diagram of FL and truncation variants of TAB2. b HA-CYPJ and Flag-tagged TAB2 fragments were co-transfected into 293T cells for co-IP assays to detect their interaction. c GST pull-down assays were performed using E.coli -expressed GST and GST-TAB2 truncations and lysates of 293T cells transfected with HA-CYPJ. # indicates the bands of GST-fused full-length and truncated TAB2. d E.coli -expressed GST and GST-fused NZF domains of TAB2, TAB3, and NEMO were used in GST pull-down assays with lysates of 293T cells transfected with HA-CYPJ or HA-CYPA. e E.coli -expressed GST and GST-fused NZF domains of LUBAC members, as well as TAB2 and TAB3 were used in GST pull-down assays with E.coli -expressed His-CYPJ. f ITC assays were performed to detect the binding of in vitro synthesized NZF peptides derived from TAB2 or TAB3 to prokaryotically expressed His-CYPJ
Article Snippet: GST and GST fusion proteins were expressed and purified from
Techniques: Transfection, Co-Immunoprecipitation Assay, Binding Assay, In Vitro, Synthesized, Derivative Assay
Journal: bioRxiv
Article Title: Sequencing of N 6 -methyl-deoxyadenosine at single-base resolution across the mammalian genome
doi: 10.1101/2023.01.16.524325
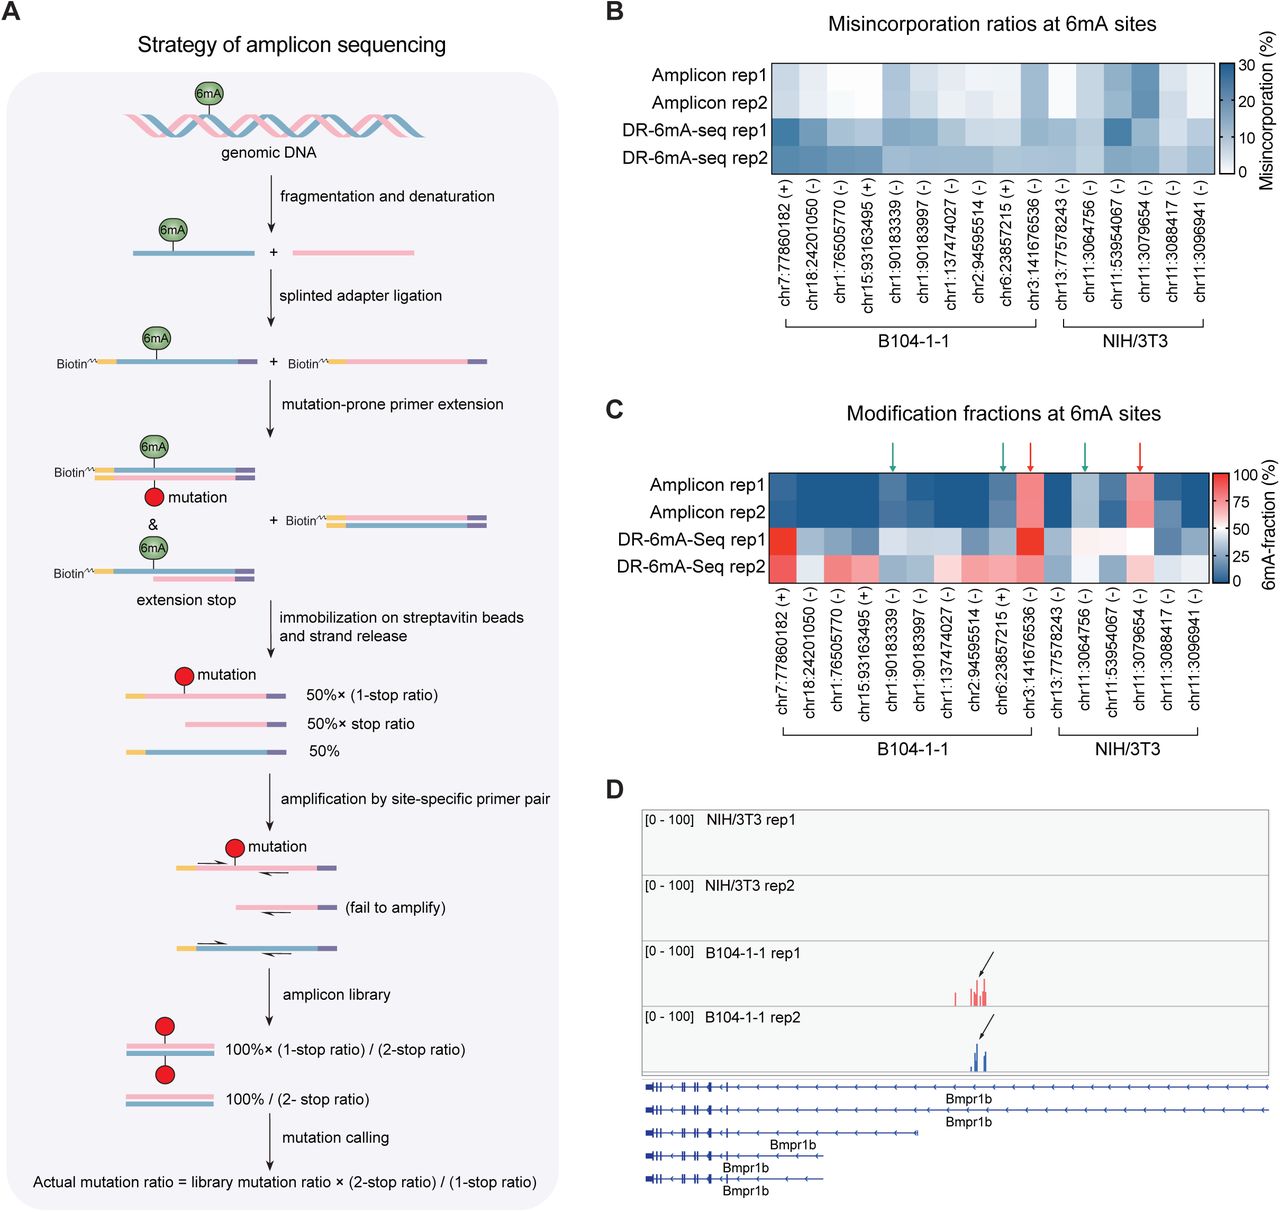
Figure Lengend Snippet: A) The 6mA-2-thio-dTTP base pair forms weaker hydrogen bonds compared to dA-dTTP and dA-2-thio-dTTP base pairs. B) Heatmap plot for the 6mA-to-T/C/G mutation ratios at 256 motifs (NN-6mA-NN) on the single-stranded model DNA after mutation-prone primer extension. C) The mutation patterns (6mA to T, C, and G respectively) at 256 motifs (NN-6mA-NN) on the single-stranded model DNA. D) FTO demethylates over 99% methylated base of NN-6mA-NN model ssDNA in vitro and shows weaker activity on dsDNA. Data are mean ± s.e.m.; analyzed by two-tailed unpaired t-tests. The number of independently repeated reactions are shown in each plot. **** P <0.0001. E) Schematic diagram of DR-6mA-seq. Genomic DNA is sequentially denatured, mixed with spike-in probes, treated with FTO (or not), ligated to biotin-tagged adaptors, and extended by Bst 2.0 DNA polymerase or Q5 high-fidelity DNA polymerase. The synthesized DNA strand is enriched and amplified for next-generation sequencing. 6mA-to-T/C/G mutations were counted for defining 6mA sites and calculating 6mA methylation stoichiometry, using spike-in calibration curves. F) Mutation profiles (including 6mA to T, C, and G) of mutation-prone primer extension on the 6mA spike-in probes harboring 0%, 25%, 50%, 75% and 100% 6mA. Primer extension on FTO-treated probes and primer extension by Q5 high-fidelity DNA polymerase serve as two control groups and do not respond to 6mA fractions. See also Table S1 .
Article Snippet:
Techniques: Mutagenesis, Methylation, In Vitro, Activity Assay, Two Tailed Test, Synthesized, Amplification, Next-Generation Sequencing, Control
Journal: bioRxiv
Article Title: Sequencing of N 6 -methyl-deoxyadenosine at single-base resolution across the mammalian genome
doi: 10.1101/2023.01.16.524325
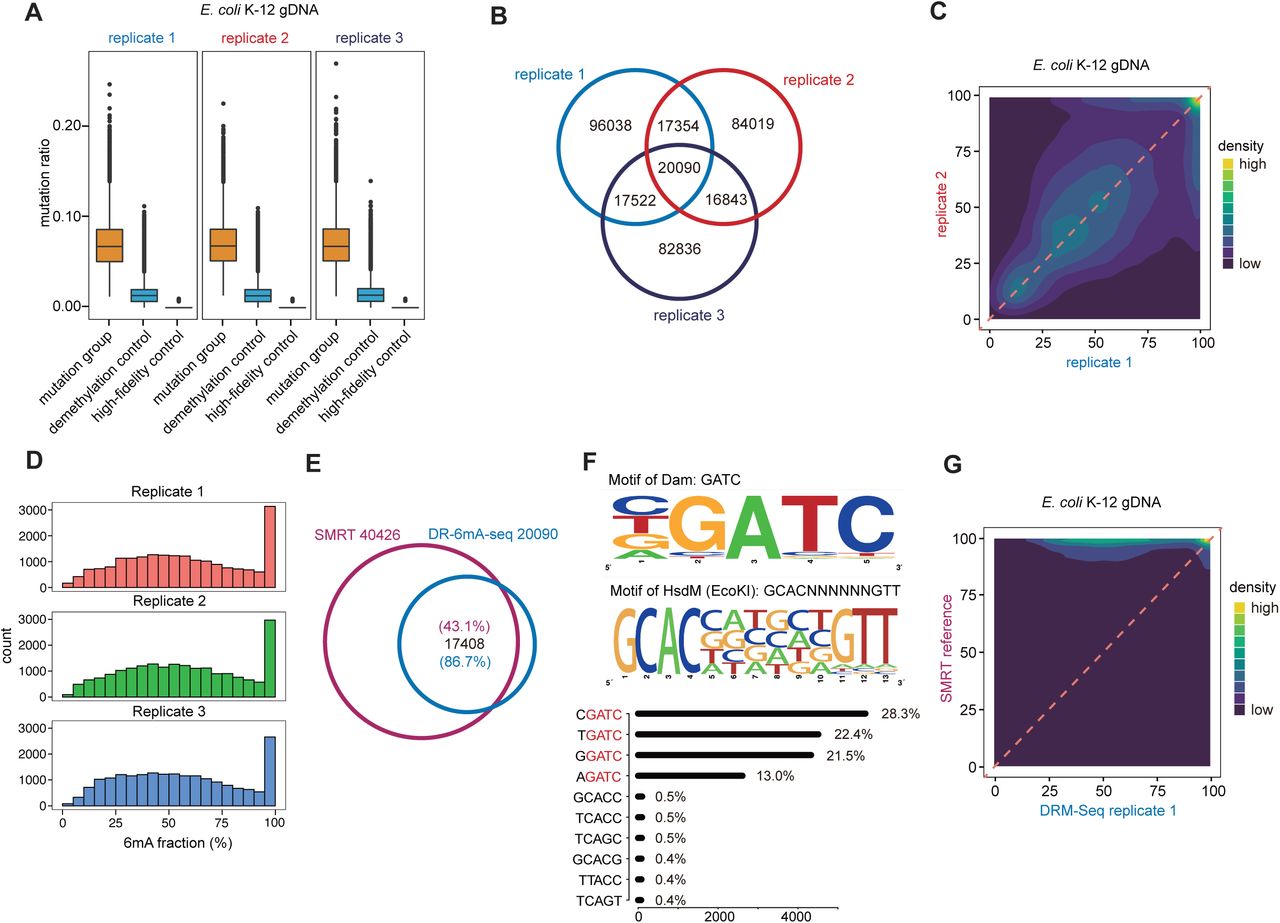
Figure Lengend Snippet: A) The box plot of mutation ratio distribution at 6mA sites detected in E. coli gDNA, revealed by DR-6mA-seq. The mutation ratios of three groups are shown, i.e., Bst 2.0 extended DNA from untreated DNA (mutation group), Bst 2.0 extended DNA from FTO-treated DNA (demethylation control), and Q5-extended DNA from untreated DNA (high-fidelity control). B) Venn diagram showing the overlapped 6mA sites among three biologically independent replicates, detected by DR-6mA-seq. C) Correlation analysis of methylation fractions in E. coli K-12 genome, indicating a high correlation between replicates of DR-6mA-seq. D) Histogram indicating the distribution of 6mA fractions at the modified sites in E. coli K-12 genome, revealed by DR-6mA-seq. E) Venn diagram showing the excellent overlap between DR-6mA-seq-detected 6mA sites and SMRT-detected 6mA sites in E. coli K-12 genome. F) Motif sequence logo and the list of consensus motifs containing 6mA sites in gDNA from E. coli K-12, uncovered by DR-6mA-seq. The frequency percentages of the top 5-base 6mA-containing motifs are shown. G) Correlation analysis of 6mA methylation fractions in E. coli K-12 genome, indicating a high correlation between 6mA sites detected by DR-6mA-seq and SMRT. See also Tables S2.
Article Snippet:
Techniques: Mutagenesis, Control, Methylation, Modification, Sequencing

Journal: bioRxiv
Article Title: Sequencing of N 6 -methyl-deoxyadenosine at single-base resolution across the mammalian genome
doi: 10.1101/2023.01.16.524325
Figure Lengend Snippet: A) The box plot of mutation ratio distribution at 6mA sites detected in HepG2 mtDNA, mouse brain mtDNA, and mouse liver mtDNA, revealed by DR-6mA-seq. The mutation ratios of three groups are shown, such as Bst 2.0 -extended DNA from untreated DNA (mutation group), Bst 2.0 -extended DNA from FTO-treated DNA (demethylation control), and Q5-extended DNA from untreated DNA (high-fidelity control). n = 2, biologically independent replicates. B) The histogram of mtDNA 6mA site number distribution normalized to 6mA fraction bins, in HepG2 cells, mouse brain, and mouse liver. n = 2, biologically independent replicates. C) Distribution of 6mA sites along the human HepG2 mitochondrial genome. The dots on the lighter orange background are mtDNA 6mA sites on the forward and reverse strand of mtDNA of HepG2 replicate 1, while the dots on the darker orange background are mtDNA 6mA sites on the forward and reverse strand of mtDNA of HepG2 replicate 2, both revealed by DR-6mA-seq. The six circled axes representing the methylation fractions at 0%, 20%, 40%, 60%, 80%, and 100%. The inner bright orange track represents overlapped mtDNA 6mA sites with 5-bp flanking windows. The inner purple track represents 6mA sites detected by ChIP-exo. D) Distribution of 6mA sites along the mouse mitochondrial genome. The dots on the purple and green background are mtDNA 6mA sites in two biological replicates of mouse brain and mouse liver, respectively, revealed by DR-6mA-seq, with six circled axes representing the methylation fractions at 0%, 20%, 40%, 60%, 80%, and 100%. The inner red track indicates the regions of uniquely mapped reads in mouse mitochondria genome. E) Chromatogram of a representative injection of 6mA (0.001 pmol) and dG standard compound (800 pmol), using LC-MS/MS. The 6mA quantification was calculated by the 6mA peak area, which displays a retention time of ∼5.8 min. F) Chromatogram of a representative injection of 6mA (0.005 pmol) and dG standard compound (300 pmol) using LC-MS/MS. The 6mA quantification was calculated by the 6mA peak area, which displays a retention time of ∼5.8 min. G) Chromatogram of a representative injection of gDNA-depleted HEK293T mtDNA (the first biological replicate), using LC-MS/MS. The optimized LC protocol can distinguish the 6mA peak from the dT+Na + peak which appears at ∼4.2 min. H) Chromatogram of a representative injection of gDNA-depleted HEK293T mtDNA (the second biological replicate), using LC-MS/MS. The optimized LC protocol can distinguish the 6mA peak from the dT+Na + peak which appears at ∼4.2 min. I) Chromatogram of a representative injection of gDNA-depleted HEK293T mtDNA (the third biological replicate), using LC-MS/MS. The optimized LC protocol can distinguish the 6mA peak from the dT+Na + peak which appears at ∼4.2 min.
Article Snippet:
Techniques: Mutagenesis, Control, Methylation, Injection, Liquid Chromatography with Mass Spectroscopy
Journal: bioRxiv
Article Title: Sequencing of N 6 -methyl-deoxyadenosine at single-base resolution across the mammalian genome
doi: 10.1101/2023.01.16.524325
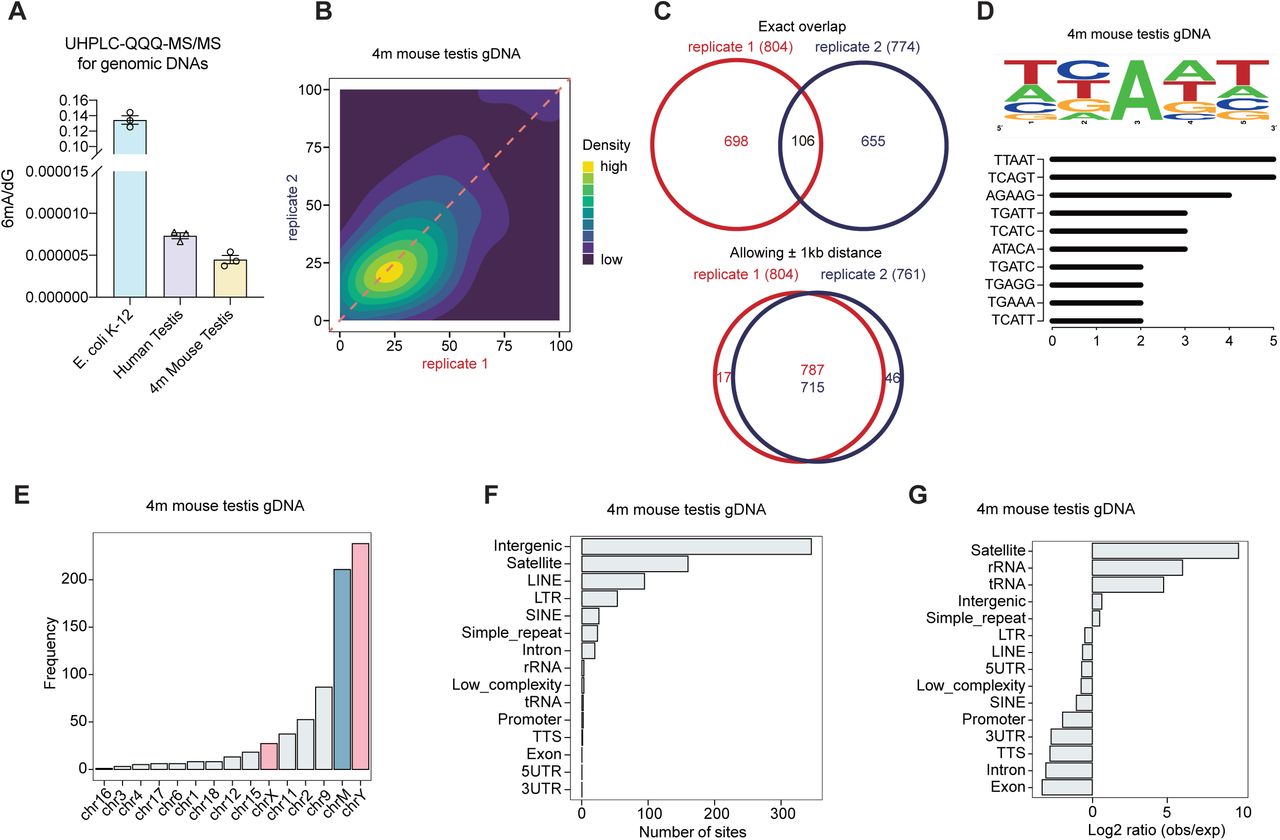
Figure Lengend Snippet: A) Quantification of 6mA level in gDNA from human and mouse intact testis by LC-MS/MS, with E. coli gDNA as a positive control. Data are mean ± s.e.m.. B) Correlation analysis of 6mA methylation fractions in antibody-enriched mouse testis gDNA, indicating a high correlation between replicates of DR-6mA-seq. C) Venn diagram showing the overlapped 6mA sites in mouse testis gDNA, allowing and not allowing ± 1 kb window, detected by DR-6mA-seq between two biologically independent replicates. D) Motif sequence logo and the list of the consensus motifs containing 6mA sites in gDNA from mouse testis, uncovered by DR-6mA-seq. E) Chromosome-wide distributions of gDNA 6mA sites in mouse testis, revealed by DR-6mA-seq. F) Genomic distributions of gDNA 6mA sites in mouse testis, revealed by DR-6mA-seq. G) Genomic enrichment of gDNA 6mA sites in mouse testis, revealed by DR-6mA-seq. See also , , and Tables S6.
Article Snippet:
Techniques: Liquid Chromatography with Mass Spectroscopy, Positive Control, Methylation, Sequencing
Journal: bioRxiv
Article Title: Sequencing of N 6 -methyl-deoxyadenosine at single-base resolution across the mammalian genome
doi: 10.1101/2023.01.16.524325
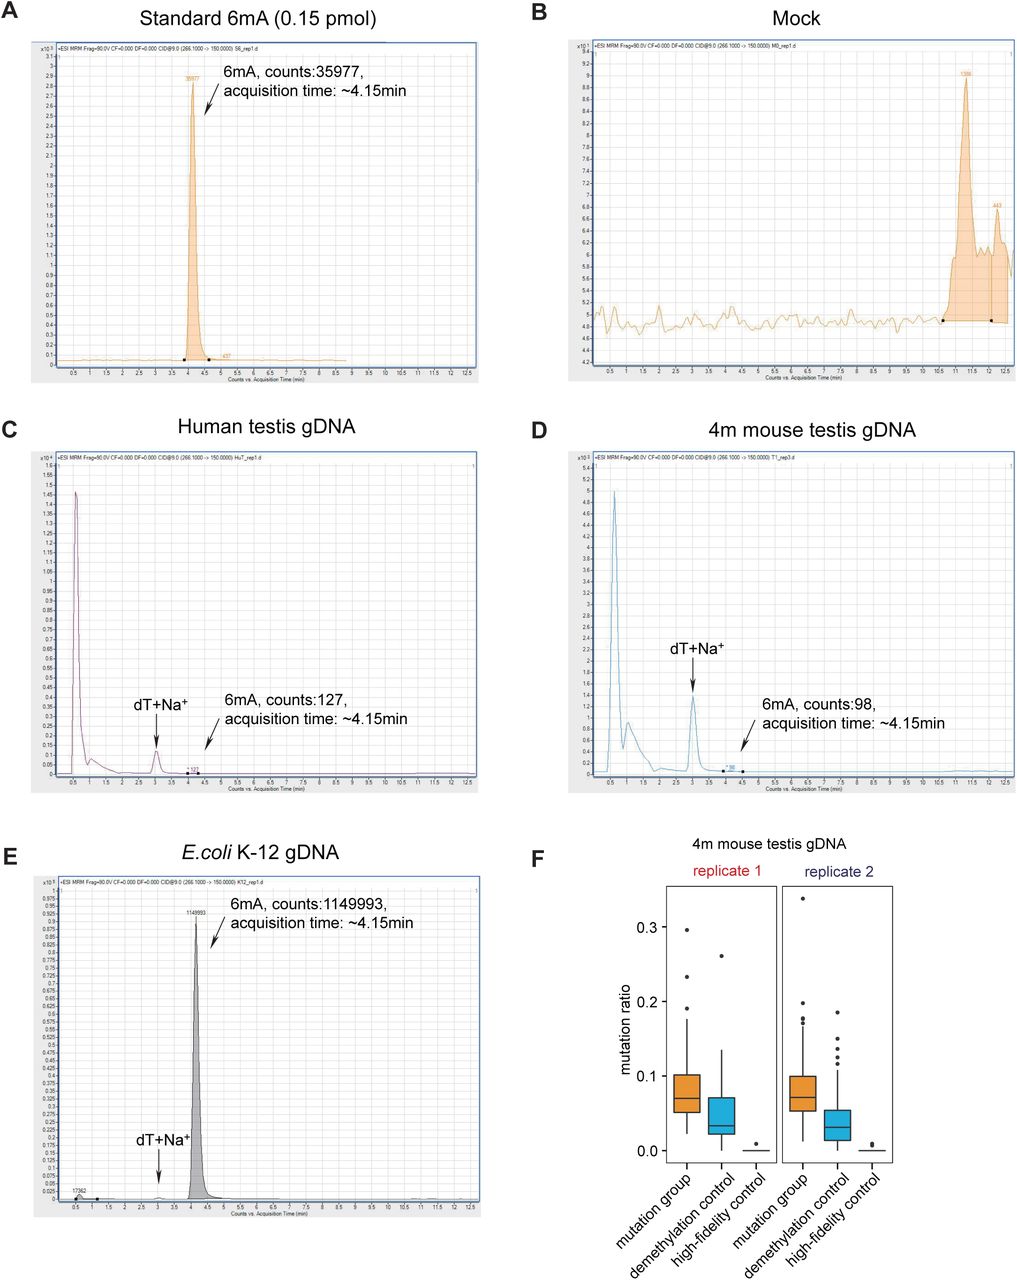
Figure Lengend Snippet: A) Chromatogram of a representative injection of 6mA standard compound, using LC-MS/MS. B) Chromatogram of a representative injection of the mock (nucleoside digestion mixture without adding any DNA) using LC-MS/MS. C) Chromatogram of a representative injection of digested human testis gDNA, using LC-MS/MS. The 6mA quantification was calculated by the 6mA peak area, which displays a retention time of ∼4.15 min. The optimized LC protocol distinguished the 6mA peak from the dT+Na + peak which appears at ∼3.00 min. D) Chromatogram of a representative injection of digested mouse testis gDNA, using LC-MS/MS. E) Chromatogram of a representative injection of E. coli K-12 gDNA, using LC-MS/MS. F) The box plot of mutation ratio distribution at 6mA sites detected in mouse testis gDNA, revealed by DR-6mA-seq. The mutation ratios of three groups are shown, such as Bst 2.0 -extended DNA from untreated DNA (mutation group), Bst 2.0 -extended DNA from FTO-treated DNA (demethylation control), and Q5-extended DNA from untreated DNA (high-fidelity control).
Article Snippet:
Techniques: Injection, Liquid Chromatography with Mass Spectroscopy, Mutagenesis, Control
Journal: bioRxiv
Article Title: Sequencing of N 6 -methyl-deoxyadenosine at single-base resolution across the mammalian genome
doi: 10.1101/2023.01.16.524325
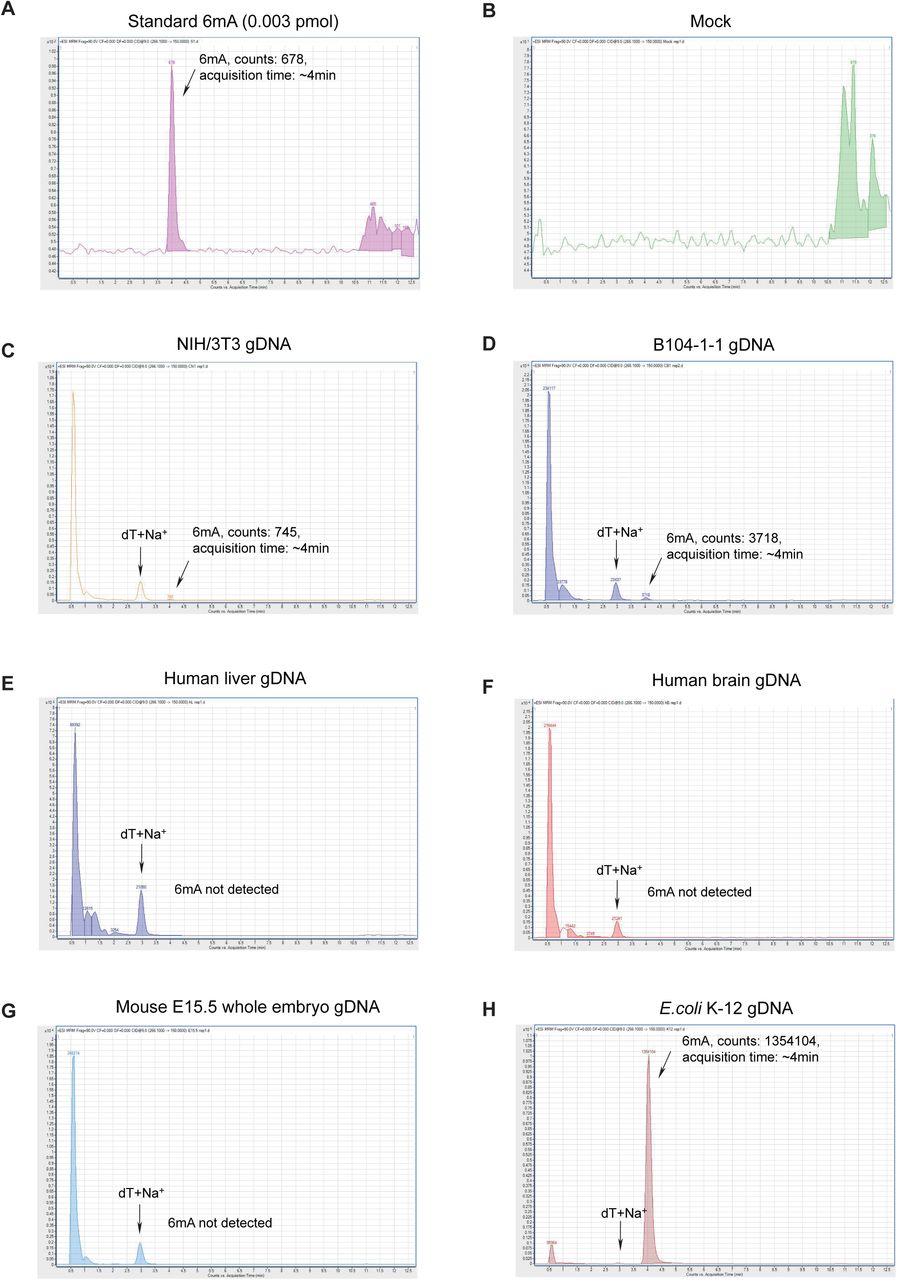
Figure Lengend Snippet: A) Chromatogram of a representative injection of 6mA standard compound, using LC-MS/MS. B) Chromatogram of a representative injection of the mock (nucleoside digestion mixture without adding any DNA) using LC-MS/MS. C) Chromatogram of a representative injection of digested gnotobiotic NIH/3T3 (ATCC) gDNA, using LC-MS/MS. The 6mA quantification was calculated by the 6mA peak area, which displays a retention time of ∼4.15 min. The optimized LC protocol distinguished the 6mA peak from the dT+Na + peak which appears at ∼3.00 min. D) Chromatogram of a representative injection of digested gnotobiotic B104-1-1 (ATCC) gDNA, using LC-MS/MS. E) Chromatogram of a representative injection of digested human liver gDNA, using LC-MS/MS. F) Chromatogram of a representative injection of digested human brain gDNA, using LC-MS/MS. G) Chromatogram of a representative injection of digested mouse E15.5 whole embryo gDNA, using LC-MS/MS. H) Chromatogram of a representative injection of E. coli K-12 gDNA, using LC-MS/MS.
Article Snippet:
Techniques: Injection, Liquid Chromatography with Mass Spectroscopy
Journal: bioRxiv
Article Title: Sequencing of N 6 -methyl-deoxyadenosine at single-base resolution across the mammalian genome
doi: 10.1101/2023.01.16.524325
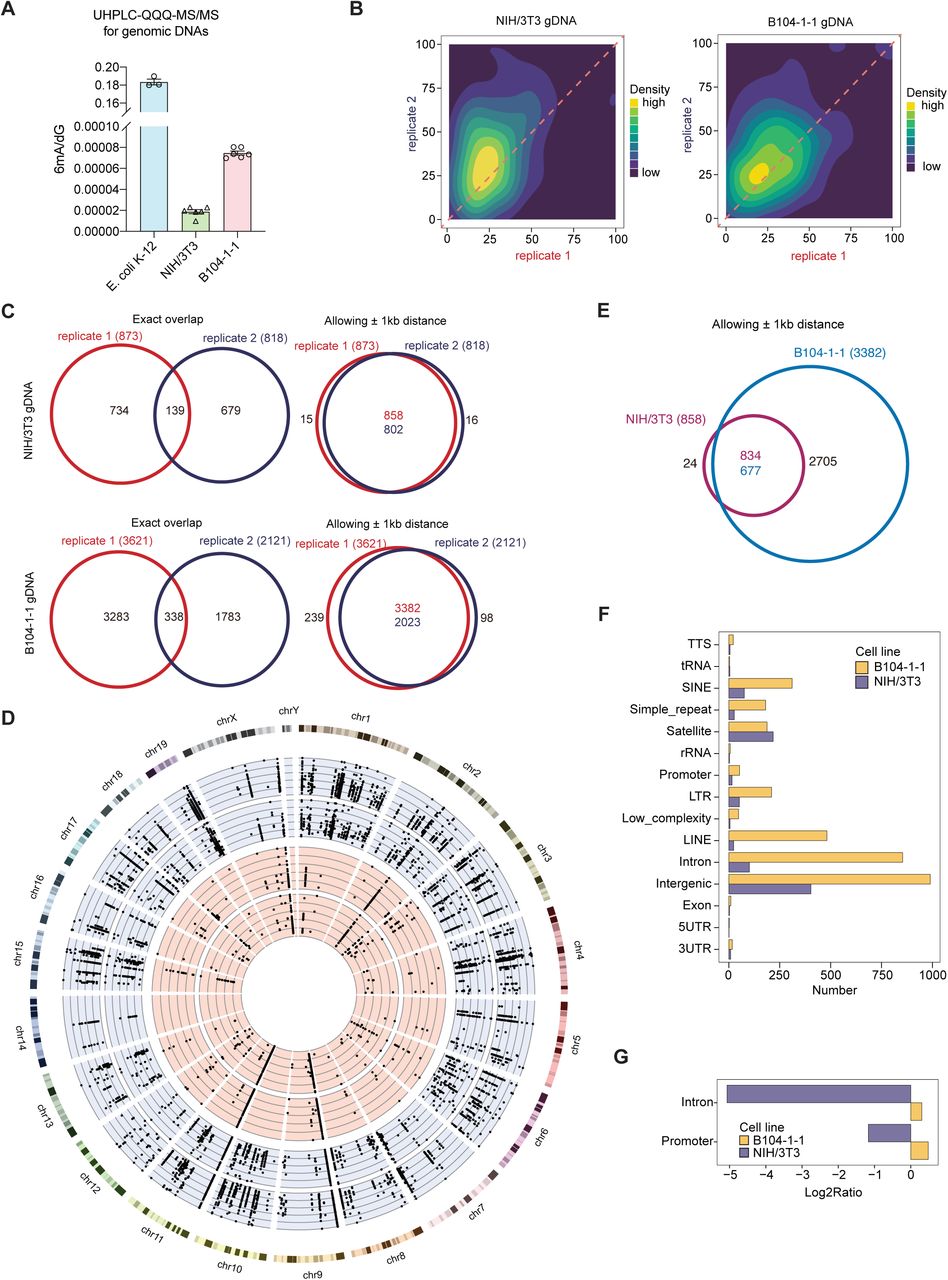
Figure Lengend Snippet: A) Quantification of 6mA level in gDNA from cultured NIH/3T3 and B104-1-1 cells, by LC-MS/MS, with E. coli gDNA as a positive control. Data are mean ± s.e.m. B) Correlation analysis of 6mA methylation fractions in antibody-enriched gDNA from NIH/3T3 and B104-1-1 cells, indicating a high correlation between replicates of DR-6mA-seq. C) Venn diagram showing the overlapped gDNA 6mA sites in NIH/3T3 and B104-1-1, allowing and not allowing ± 1 kb window, detected by DR-6mA-seq between two biologically independent replicates. D) Distributions of 6mA sites along the mouse genome. The dots on the blue and red background are gDNA 6mA sites in two biologically independent replicates of B104-1-1 and NIH/3T3 cells, respectively, revealed by DR-6mA-seq, with six circled axes representing the methylation fractions at 0%, 20%, 40%, 60%, 80%, and 100%. E) Venn diagram showing the overlapped gDNA 6mA sites between NIH/3T3 and B104-1-1 cells, allowing ± 1 kb window. F) Genomic distributions of gDNA 6mA sites in NIH/3T3 and B104-1-1 cells, revealed by DR-6mA-seq. G) Genomic enrichment of gDNA 6mA sites identified in NIH/3T3 and B104-1-1 cells, revealed by DR-6mA-seq. Enrichment scores on intron and promoter are shown. See also - and Tables S7-S8.
Article Snippet:
Techniques: Cell Culture, Liquid Chromatography with Mass Spectroscopy, Positive Control, Methylation
Journal: bioRxiv
Article Title: Sequencing of N 6 -methyl-deoxyadenosine at single-base resolution across the mammalian genome
doi: 10.1101/2023.01.16.524325
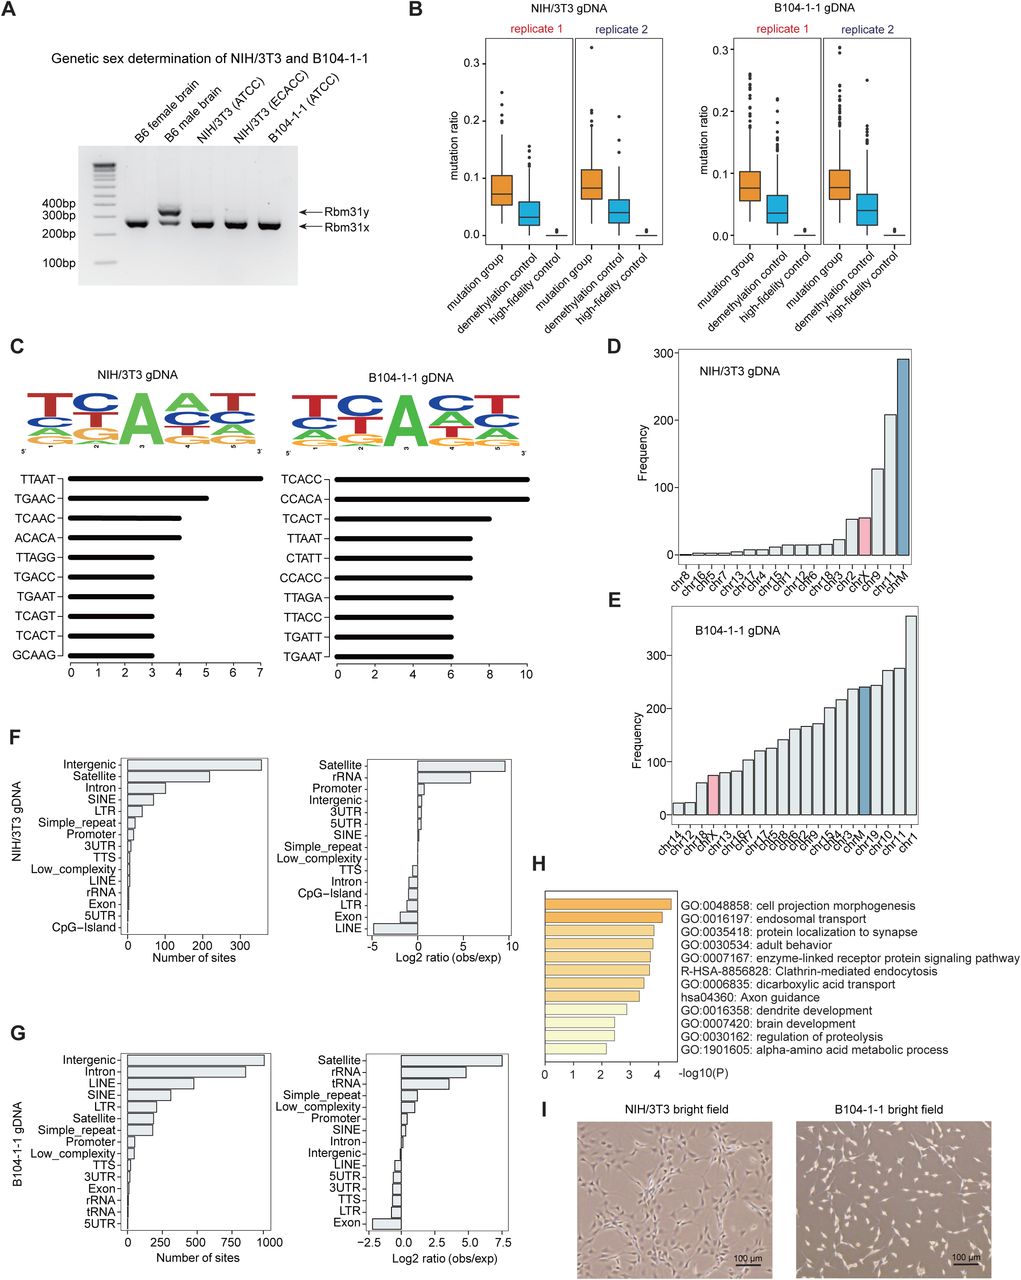
Figure Lengend Snippet: A) Genetic sex determination of NIH/3T3 and B104-1-1 cell lines by amplification of Rbm31x and Rbm31y by simplex PCR, with female and male mouse brains as controls. B) The box plot of mutation ratio distribution at 6mA sites detected in gDNA from NIH/3T3 (ATCC) and B104-1-1 (ATCC) cells, revealed by DR-6mA-seq. The mutation ratios of three groups are shown, such as Bst 2.0 extended DNA from untreated DNA (mutation group), Bst 2.0 extended DNA from FTO-treated DNA (demethylation control), and Q5-extended DNA from untreated DNA (high-fidelity control). C) Motif sequence logo and top 10 consensus motifs containing 6mA sites in gDNA from NIH/3T3 (ATCC) and B104-1-1 cells, uncovered by DR-6mA-seq. D) Chromosome-wide distributions of 6mA sites in gDNA from NIH/3T3. E) Chromosome-wide distributions of 6mA sites in gDNA from B104-1-1. F) Gene annotation shows the genomic distributions and enrichment of gDNA 6mA sites in NIH/3T3 cell lines, revealed by DR-6mA-seq. G) Gene annotation shows the genomic distributions and enrichment of gDNA 6mA sites identified in B104-1-1 cell lines, revealed by DR-6mA-seq. H) The enriched GO clusters of 6mA-modified genes in B104-1-1 cells. Genes with 6mA sites on exons, introns, and promoters are considered as 6mA-modified genes. I) Bright field photographs of NIH/3T3 and B104-1-1 cells.
Article Snippet:
Techniques: Amplification, Mutagenesis, Control, Sequencing, Modification
Journal: bioRxiv
Article Title: Sequencing of N 6 -methyl-deoxyadenosine at single-base resolution across the mammalian genome
doi: 10.1101/2023.01.16.524325
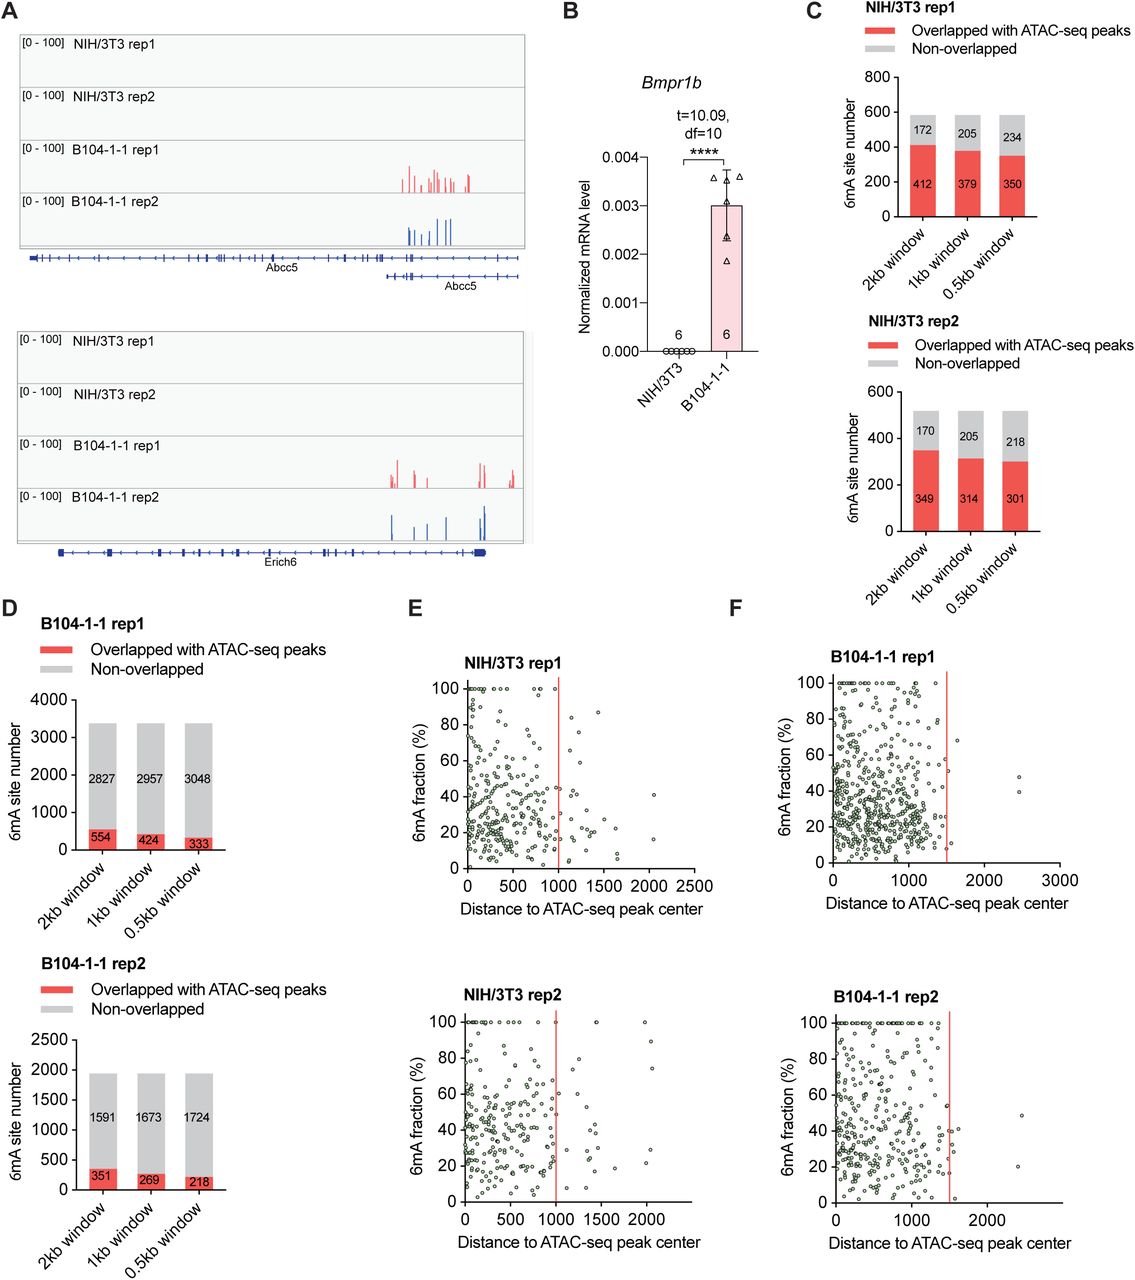
Figure Lengend Snippet: A) Two representative cell-line-specific gDNA 6mA clusters located at Abcc5 and Erich6 in B104-1-1 cells. B) RT-qPCR quantification of Bmpr1b expression level in NIH/3T3 and B104-1-1 cells, normalized to Actb . Data are mean ± s.e.m.; analyzed by two-tailed unpaired t-tests. The number of independently repeated reactions is shown in each plot. **** P <0.0001. C) The NIH/3T3 gDNA 6mA site number overlapped with ATAC-seq peaks from wild-type NIH/3T3 cells (GSE119781), by setting a sliding window of 500 bp, 1,000 bp, or 2,000 bp centered at the 6mA site revealed by DR-6mA-seq. D) The B104-1-1 gDNA 6mA site number overlapped with ATAC-seq peaks from glioblastoma tumor induced by implanted GL261 cells (GSE206551), by setting a sliding window of 500 bp, 1,000 bp, or 2,000 bp centered at the 6mA site revealed by DR-6mA-seq. E) The 2-D plot of NIH/3T3 gDNA 6mA methylation fraction versus the distance to ATAC-seq peak center (GSE119781), most 6mA sites distribute within ±1,000 bp range around ATAC-seq peak center. F) The 2-D plot of B104-1-1 gDNA 6mA methylation fraction versus the distance to ATAC-seq peak center (GSE206551), most 6mA sites distribute within ±1,500 bp range around ATAC-seq peak center.
Article Snippet:
Techniques: Quantitative RT-PCR, Expressing, Two Tailed Test, Methylation
Journal: bioRxiv
Article Title: Sequencing of N 6 -methyl-deoxyadenosine at single-base resolution across the mammalian genome
doi: 10.1101/2023.01.16.524325
Figure Lengend Snippet: A) A flowchart of amplicon assay for gDNA 6mA validation, revealing 6mA fraction by adjusted misincorporation ratios. B) The actual misincorporation ratios obtained in amplicon assay versus the misincorporation calculated from DR-6mA-seq data. C) The 6mA methylation fractions by amplicon assay versus 6mA fractions calculated from DR-6mA-seq data. gDNA 6mA sites showing >70% estimated modification in amplicon assay were marked by red arrows; other gDNA 6mA sites showing above 10% modification fraction were labeled by green arrows. For B) and C), 16 gDNA 6mA sites were investigated, with 6 from NIH/3T3 cells and 10 from B104-1-1 cells. D) A representative 6mA cluster located at Bmpr1b , with the arrow marking the 6mA site of the highest modification fraction identified in C). See also - .
Article Snippet:
Techniques: Amplification, Biomarker Discovery, Methylation, Modification, Labeling
Journal: medRxiv
Article Title: Human cell-camouflaged nanomagnetic scavengers restore immune homeostasis in a rodent model with bacteremia
doi: 10.1101/2022.03.16.22272481
Figure Lengend Snippet: Characterization and pathogen-binding efficiency of MNVs. a) Quantitative measurement of the pathogen-binding-related surface receptors on hRBC-MNVs and hWBC-MNVs. b) Binding efficiencies of hRBC-MNVs, GYPA-blocked hRBC-MNVs, CR1-blocked hRBC-MNVs, GYPA- and CR1-blocked hRBC-MNVs to methicillin-resistant S. aureus (MRSA), extended-spectrum β-lactamase-positive E. coli (ESBL-EC), RSV, CMV, Zika virus (ZIKV) E protein, HCoV-OC43, and SARS-CoV-2 S protein in human plasma. c) Binding efficiencies of hWBC-MNVs, CR1-blocked hWBC-MNVs, CR3-blocked hWBC-MNVs, and CR1- and CR3-blocked hWBC-MNVs to MRSA, ESBL-EC, RSV, CMV, ZIKV E protein, HCoV-OC43, and SARS-CoV-2 S protein in human plasma. d,e) Binding efficiencies of d) hRBC-MNVs and e) hWBC-MNVs to MRSA and ESBL-EC when supplemented with MBL, ficolin (FCN)-1, or C3b in TBS buffer. f,g) Binding efficiencies of f) hRBC-MNVs and g) hWBC-MNVs to MRSA and ESBL-EC when supplemented with MBL, FCN-1, or C3b in human blood. h,i) Binding efficiency of h) hRBC-MNVs and i) hWBC-MNVs to HCoV-OC43, RSV, CMV, SARS-CoV-2 S protein, and Zika virus (ZIKV) E protein in TBS buffer supplemented with MBL, FCN-1, or C3b. j) Binding efficiency of hWBC-MNVs to SARS-CoV-2 S protein when supplemented with MBL, FCN-1, or anti-SARS-CoV-2 S protein immunoglobulin G (IgG). k) D-glucose depletion in diabetic rat blood by repetitive incubation and magnetic depletion using hRBC-MNVs. l) MRSA spiked in diabetic rat blood was magnetically depleted using hRBC-MNVs. m) Fecal bacterial concentrations in human whole blood were significantly (99.97%) reduced after a single round of magnetic depletion using hRBC-MNVs. n) The removal efficiency of SARS-CoV-2 spike protein and their variants (B.1.1.7, B.1351, B.1.617.2 and B.1.1.529) using hWBC-MNVs. Data were expressed as means ± SEM. Statistical significance was calculated by a two-tailed Student’s t test. * P < 0.05; ** P < 0.005; *** P < 0.001; NS, not significant.
Article Snippet: The SARS-CoV-2 Spike protein (10 µg, 40589-V08B1, Sinobiological, Beijing, China) and
Techniques: Binding Assay, Incubation, Two Tailed Test

Journal: medRxiv
Article Title: Human cell-camouflaged nanomagnetic scavengers restore immune homeostasis in a rodent model with bacteremia
doi: 10.1101/2022.03.16.22272481
Figure Lengend Snippet: Continuous removal of pathogens and cytokines in the bacteremic blood using a blood-cleansing system in vitro. a) A blood-cleansing system for in vitro pathogen removal. Pathogen-inoculated blood mixed with MNVs flows into the incubation loop. After flowing through the mixing component, the pathogen-bound MNVs are magnetically captured on the bottom of the magnetic blood-cleansing device by the Halbach magnet array placed under the device. b) The removal efficiency of MRSA calculated by the Monod kinetics model corresponded to the experimental results for human blood ( n = 3). c,d) The removal efficiency of antibiotic-resistant bacterial strains using hRBC-MNVs. The magnetic depletion rates of c) S. aureus , vancomysin-intermediate S. aureus (VISA), and MRSA and d) E. coli , ESBL-EC, and carbapenem-resistant E. coli (CR E. coli ) using hRBC-MNVs in human blood. e,f) The removal efficiency of e) LPS using hRBC-MNVs and f) interleukin-6 (IL-6) using rRBC-MNVs. g) Removal efficiency of HCoV-OC43, CMV, RSV, and Zika virus (ZIKV) E protein using hWBC-MNVs in human blood. h) Removal efficiency of SARS-CoV-2 S protein using hWBC-MNVs was augmented by supplementing anti-SARS-CoV-2 S protein IgG in human blood. Data were expressed as means ± SEM. * P < 0.05; ** P < 0.005 (a two-tailed Student’s t test).
Article Snippet: The SARS-CoV-2 Spike protein (10 µg, 40589-V08B1, Sinobiological, Beijing, China) and
Techniques: In Vitro, Incubation, Two Tailed Test