Review


quantity one software  (Bio-Rad)


Bioz Verified Symbol Bio-Rad is a verified supplier
Bioz Manufacturer Symbol Bio-Rad manufactures this product  
  • Logo
  • About
  • News
  • Press Release
  • Team
  • Advisors
  • Partners
  • Contact
  • Bioz Stars
  • Bioz vStars
  • 96

    Structured Review

    Bio-Rad quantity one software
    Quantity One Software, supplied by Bio-Rad, used in various techniques. Bioz Stars score: 96/100, based on 3487 PubMed citations. ZERO BIAS - scores, article reviews, protocol conditions and more
    https://www.bioz.com/product/human+version+02/ChromLab+Software/pmc05920277-145-4-9
    Average 96 stars, based on 3487 article reviews
    quantity one software - by Bioz Stars, 2026-10
    96/100 stars

    Images

    Related Articles

    Software:

    Article Title: Quantification of major royal jelly protein variants and concurrent fraud identification to confirm royal jelly quality employing the native LC-SEC-UV methodology
    Article Snippet: Traditional protein assays and 10-Hydroxy-2-decenoic acid (10-HDA) analysis are inefficient for assessing royal jelly (RJ) freshness and authenticity.. Structural integrities, thus efficacies of the Major Royal Jelly Proteins (MRJPs) might be modified based on storage conditions.. Total protein assays are incapable of identifying MRJP aggregation or degradation.

    Article Title: CD46 is a cellular receptor for species D human adenovirus.
    Article Snippet: .. Using an NGC chromatography system (BioRad) with the ChromLab software, the sample was bound to an anion exchange column (HiTrap Q FF, Cytiva). ..

    Article Title: Surface functionalization with short PAS-sequence affects H-ferritin nanocage stability.
    Article Snippet: .. Fractions of 0.5 mL were collected by monitoring the chromatogram from the integrated ChromLab Software (Bio-Rad). .. PAS20-HFn and PAS40-HFn collected fractions were quantified employing NanoDrop 2000c (Thermo Fisher Scientific) by 280 nm absorbance (A280) and PierceTM Bradford Plus Protein Assay Reagent (Thermo Fisher), according to manufacturing specifications.

    Article Title: Tau phosphorylation impedes functionality of protective tau envelopes.
    Article Snippet: The next day, the cleaved protein was collected and concentrated by spinning the sample at 3,500 rpm at 4 °C using a 50-kDa (for full-length tau) or 10-kDa (for tau-∆N) centrifugal filter tube (Amicon Ultra-15, Merck). .. The protein was purified by size-exclusion chromatography using a Superdex 200 10/300 GL column (GE28-9909-44, Sigma) with an NGC chromatography system (Bio-Rad), equipped with ChromLab software (Bio-Rad), in 50 mM HEPES pH 7.4, 2 mM MgCl2, 1 mM EGTA, 150 mM KCl, 1 mM DTT, 0.1 mM ATP and 1 mM EDTA. .. Collected peak fractions were concentrated using a 50-kDa (for full-length tau) or 10-kDa (for tau-∆N) centrifugal filter tube (Amicon Ultra-15, Merck).

    Article Title: Tau phosphorylation impedes functionality of protective tau envelopes
    Article Snippet: The next day, the cleaved protein was collected and concentrated by spinning the sample at 3,500 rpm at 4 °C using a 50-kDa (for full-length tau) or 10-kDa (for tau-∆N) centrifugal filter tube (Amicon Ultra-15, Merck). .. The protein was purified by size-exclusion chromatography using a Superdex 200 10/300 GL column (GE28-9909-44, Sigma) with an NGC chromatography system (Bio-Rad), equipped with ChromLab software (Bio-Rad), in 50 mM HEPES pH 7.4, 2 mM MgCl 2 , 1 mM EGTA, 150 mM KCl, 1 mM DTT, 0.1 mM ATP and 1 mM EDTA. .. Collected peak fractions were concentrated using a 50-kDa (for full-length tau) or 10-kDa (for tau-∆N) centrifugal filter tube (Amicon Ultra-15, Merck).

    Article Title: CD46 is a cellular receptor for species D human adenovirus
    Article Snippet: .. Using an NGC chromatography system (BioRad) with the ChromLab software, the sample was bound to an anion exchange column (HiTrap Q FF, Cytiva). ..

    Article Title: Engineered antibodies that stabilize drug-modified KRAS G12C neoantigens enable selective and potent cross-HLA immunotherapy.
    Article Snippet: .. Solubilized β2m was loaded onto a 5-mL HisTrap HP immobilizedmetal affinity chromatography (IMAC) column (Cytiva, 17-5248- 02) installed on a NGC Discover (Bio-Rad, 7880009) operated using ChromLab software (Bio-Rad, v6.1.29.0). ..

    Article Title: Engineered antibodies that stabilize drug-modified KRAS G12C neoantigens enable selective and potent cross-HLA immunotherapy
    Article Snippet: IFNy was quantified using the LEGENDplex Human CD8/NK Panel (13-plex) V02 (BioLegend, 741187). .. Solubilized β2m was loaded onto a 5-mL HisTrap HP immobilized metal affinity chromatography (IMAC) column (Cytiva, 17-5248-02) installed on a NGC Discover (Bio-Rad, 7880009) operated using ChromLab software (Bio-Rad, v6.1.29.0). .. Supernatants were diluted by 2-4-fold with BioLegend assay buffer before shaking incubation together with standards in a V-bottom plate with analyte-specific capture beads for 2 h. Samples and standards were tested in technical triplicates and duplicates, respectively.

    Chromatography:

    Article Title: CD46 is a cellular receptor for species D human adenovirus.
    Article Snippet: .. Using an NGC chromatography system (BioRad) with the ChromLab software, the sample was bound to an anion exchange column (HiTrap Q FF, Cytiva). ..

    Article Title: Tau phosphorylation impedes functionality of protective tau envelopes.
    Article Snippet: The next day, the cleaved protein was collected and concentrated by spinning the sample at 3,500 rpm at 4 °C using a 50-kDa (for full-length tau) or 10-kDa (for tau-∆N) centrifugal filter tube (Amicon Ultra-15, Merck). .. The protein was purified by size-exclusion chromatography using a Superdex 200 10/300 GL column (GE28-9909-44, Sigma) with an NGC chromatography system (Bio-Rad), equipped with ChromLab software (Bio-Rad), in 50 mM HEPES pH 7.4, 2 mM MgCl2, 1 mM EGTA, 150 mM KCl, 1 mM DTT, 0.1 mM ATP and 1 mM EDTA. .. Collected peak fractions were concentrated using a 50-kDa (for full-length tau) or 10-kDa (for tau-∆N) centrifugal filter tube (Amicon Ultra-15, Merck).

    Article Title: Tau phosphorylation impedes functionality of protective tau envelopes
    Article Snippet: The next day, the cleaved protein was collected and concentrated by spinning the sample at 3,500 rpm at 4 °C using a 50-kDa (for full-length tau) or 10-kDa (for tau-∆N) centrifugal filter tube (Amicon Ultra-15, Merck). .. The protein was purified by size-exclusion chromatography using a Superdex 200 10/300 GL column (GE28-9909-44, Sigma) with an NGC chromatography system (Bio-Rad), equipped with ChromLab software (Bio-Rad), in 50 mM HEPES pH 7.4, 2 mM MgCl 2 , 1 mM EGTA, 150 mM KCl, 1 mM DTT, 0.1 mM ATP and 1 mM EDTA. .. Collected peak fractions were concentrated using a 50-kDa (for full-length tau) or 10-kDa (for tau-∆N) centrifugal filter tube (Amicon Ultra-15, Merck).

    Article Title: CD46 is a cellular receptor for species D human adenovirus
    Article Snippet: .. Using an NGC chromatography system (BioRad) with the ChromLab software, the sample was bound to an anion exchange column (HiTrap Q FF, Cytiva). ..

    Purification:

    Article Title: Tau phosphorylation impedes functionality of protective tau envelopes.
    Article Snippet: The next day, the cleaved protein was collected and concentrated by spinning the sample at 3,500 rpm at 4 °C using a 50-kDa (for full-length tau) or 10-kDa (for tau-∆N) centrifugal filter tube (Amicon Ultra-15, Merck). .. The protein was purified by size-exclusion chromatography using a Superdex 200 10/300 GL column (GE28-9909-44, Sigma) with an NGC chromatography system (Bio-Rad), equipped with ChromLab software (Bio-Rad), in 50 mM HEPES pH 7.4, 2 mM MgCl2, 1 mM EGTA, 150 mM KCl, 1 mM DTT, 0.1 mM ATP and 1 mM EDTA. .. Collected peak fractions were concentrated using a 50-kDa (for full-length tau) or 10-kDa (for tau-∆N) centrifugal filter tube (Amicon Ultra-15, Merck).

    Article Title: Tau phosphorylation impedes functionality of protective tau envelopes
    Article Snippet: The next day, the cleaved protein was collected and concentrated by spinning the sample at 3,500 rpm at 4 °C using a 50-kDa (for full-length tau) or 10-kDa (for tau-∆N) centrifugal filter tube (Amicon Ultra-15, Merck). .. The protein was purified by size-exclusion chromatography using a Superdex 200 10/300 GL column (GE28-9909-44, Sigma) with an NGC chromatography system (Bio-Rad), equipped with ChromLab software (Bio-Rad), in 50 mM HEPES pH 7.4, 2 mM MgCl 2 , 1 mM EGTA, 150 mM KCl, 1 mM DTT, 0.1 mM ATP and 1 mM EDTA. .. Collected peak fractions were concentrated using a 50-kDa (for full-length tau) or 10-kDa (for tau-∆N) centrifugal filter tube (Amicon Ultra-15, Merck).

    Size-exclusion Chromatography:

    Article Title: Tau phosphorylation impedes functionality of protective tau envelopes.
    Article Snippet: The next day, the cleaved protein was collected and concentrated by spinning the sample at 3,500 rpm at 4 °C using a 50-kDa (for full-length tau) or 10-kDa (for tau-∆N) centrifugal filter tube (Amicon Ultra-15, Merck). .. The protein was purified by size-exclusion chromatography using a Superdex 200 10/300 GL column (GE28-9909-44, Sigma) with an NGC chromatography system (Bio-Rad), equipped with ChromLab software (Bio-Rad), in 50 mM HEPES pH 7.4, 2 mM MgCl2, 1 mM EGTA, 150 mM KCl, 1 mM DTT, 0.1 mM ATP and 1 mM EDTA. .. Collected peak fractions were concentrated using a 50-kDa (for full-length tau) or 10-kDa (for tau-∆N) centrifugal filter tube (Amicon Ultra-15, Merck).

    Article Title: Tau phosphorylation impedes functionality of protective tau envelopes
    Article Snippet: The next day, the cleaved protein was collected and concentrated by spinning the sample at 3,500 rpm at 4 °C using a 50-kDa (for full-length tau) or 10-kDa (for tau-∆N) centrifugal filter tube (Amicon Ultra-15, Merck). .. The protein was purified by size-exclusion chromatography using a Superdex 200 10/300 GL column (GE28-9909-44, Sigma) with an NGC chromatography system (Bio-Rad), equipped with ChromLab software (Bio-Rad), in 50 mM HEPES pH 7.4, 2 mM MgCl 2 , 1 mM EGTA, 150 mM KCl, 1 mM DTT, 0.1 mM ATP and 1 mM EDTA. .. Collected peak fractions were concentrated using a 50-kDa (for full-length tau) or 10-kDa (for tau-∆N) centrifugal filter tube (Amicon Ultra-15, Merck).

    Affinity Chromatography:

    Article Title: Engineered antibodies that stabilize drug-modified KRAS G12C neoantigens enable selective and potent cross-HLA immunotherapy.
    Article Snippet: .. Solubilized β2m was loaded onto a 5-mL HisTrap HP immobilizedmetal affinity chromatography (IMAC) column (Cytiva, 17-5248- 02) installed on a NGC Discover (Bio-Rad, 7880009) operated using ChromLab software (Bio-Rad, v6.1.29.0). ..

    Article Title: Engineered antibodies that stabilize drug-modified KRAS G12C neoantigens enable selective and potent cross-HLA immunotherapy
    Article Snippet: IFNy was quantified using the LEGENDplex Human CD8/NK Panel (13-plex) V02 (BioLegend, 741187). .. Solubilized β2m was loaded onto a 5-mL HisTrap HP immobilized metal affinity chromatography (IMAC) column (Cytiva, 17-5248-02) installed on a NGC Discover (Bio-Rad, 7880009) operated using ChromLab software (Bio-Rad, v6.1.29.0). .. Supernatants were diluted by 2-4-fold with BioLegend assay buffer before shaking incubation together with standards in a V-bottom plate with analyte-specific capture beads for 2 h. Samples and standards were tested in technical triplicates and duplicates, respectively.


    Similar Products

    93
    Miltenyi Biotec ffpe version 02
    Ffpe Version 02, supplied by Miltenyi Biotec, used in various techniques. Bioz Stars score: 93/100, based on 1 PubMed citations. ZERO BIAS - scores, article reviews, protocol conditions and more
    https://www.bioz.com/product/human+version+02/REAscreen+MAX+Kit%2C+human%2C+FFPE/pmc12800044-93-7-10
    Average 93 stars, based on 1 article reviews
    ffpe version 02 - by Bioz Stars, 2026-10
    93/100 stars
      Buy from Supplier

    93
    Vazyme Biotech Co v8 version high throughput transcriptomics sequenc ing library preparation kit
    V8 Version High Throughput Transcriptomics Sequenc Ing Library Preparation Kit, supplied by Vazyme Biotech Co, used in various techniques. Bioz Stars score: 93/100, based on 1 PubMed citations. ZERO BIAS - scores, article reviews, protocol conditions and more
    https://www.bioz.com/product/human+version+02/FastSelect+rRNA+Kit+-+Human/pm41363534-58-33-42
    Average 93 stars, based on 1 article reviews
    v8 version high throughput transcriptomics sequenc ing library preparation kit - by Bioz Stars, 2026-10
    93/100 stars
      Buy from Supplier

    97
    Miltenyi Biotec flow cytometry based macs marker screen
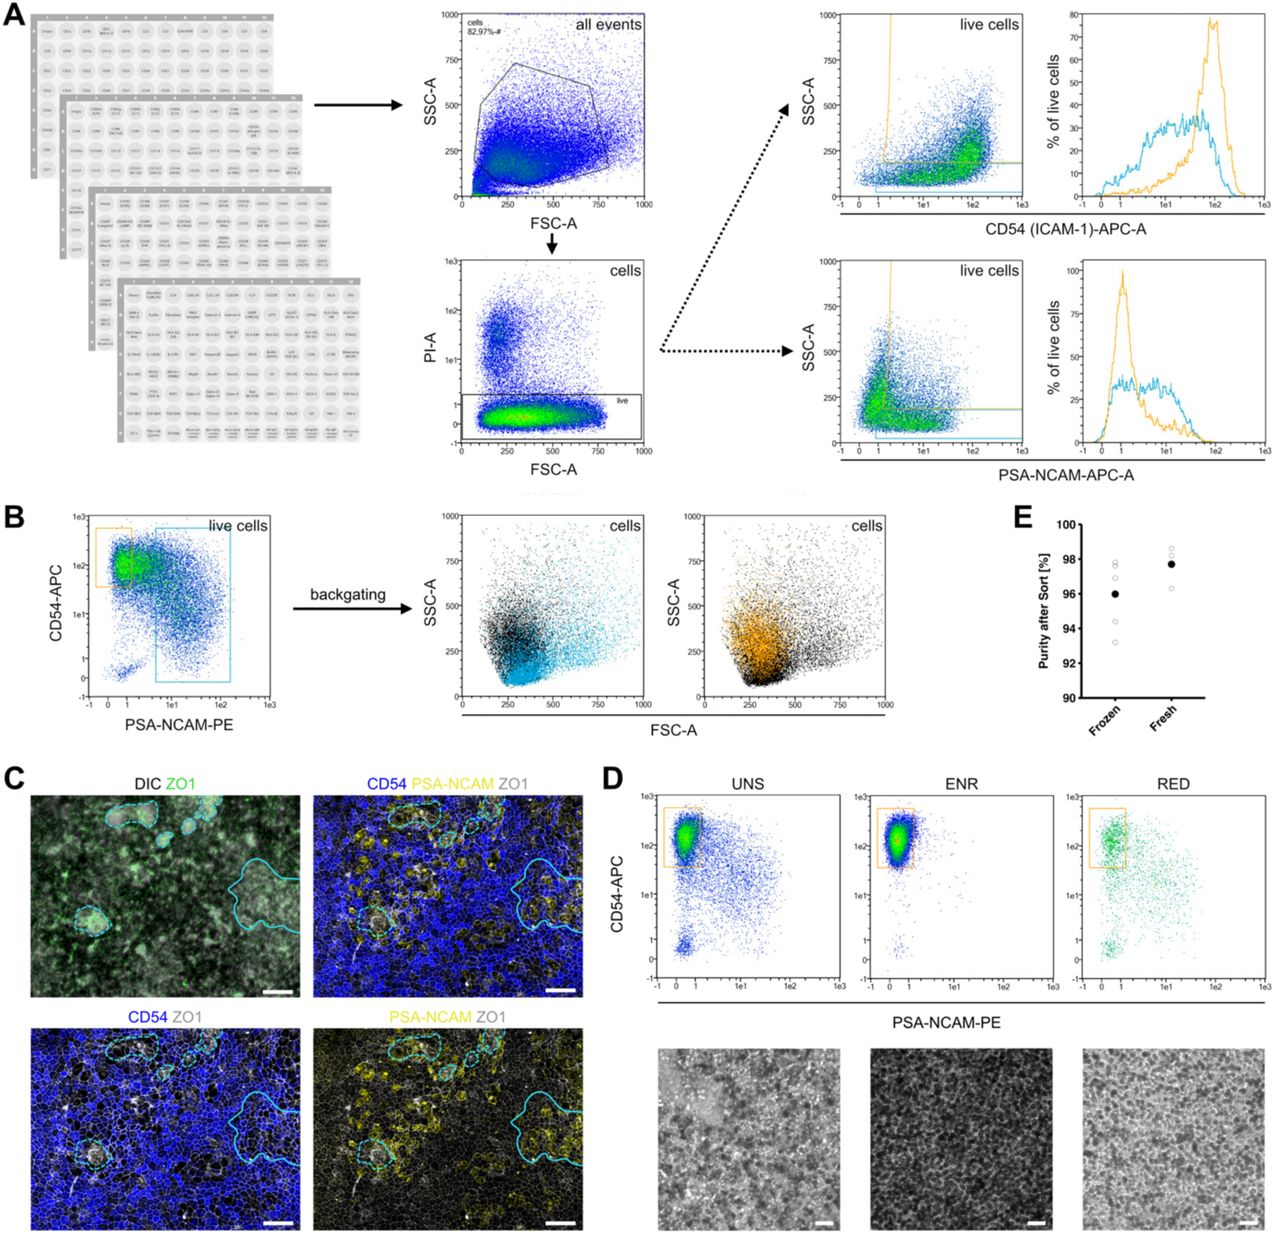
    Identification and validation of cell surface sorting markers for iPSC-derived P1 RPE cells (A) P1 RPE cells were screened for expression of 371 antibodies directed against cell surface markers using flow <t>cytometry.</t> Hits were identified based on correlation to side scatter (SSC) intensity as proxy for pigmentation, here shown for CD54 (ICAM-1) (positive correlation) and PSA-NCAM (negative correlation). (B) Combinatorial staining for CD54 and PSA-NCAM reliably discriminates SSC-low non-target (unpigmented, backgated in blue) and SSC-high target cells (pigmented, backgated in orange). (C) Immunofluorescent staining of RPE cells in culture shows cells expressing PSA-NCAM but little CD54 mostly in regions lacking pigmentation and proper cobblestone morphology (areas highlighted by dashed lines). Co-expression of CD54 and PSA-NCAM appears to occur primarily in regions of intermediate pigmentation levels and mixed cobblestone morphology (area highlighted by solid line) (D) Flow scatter and corresponding transmitted light microscopy images for unsorted (UNS), CD54 + /PSA-NCAM - -enriched (ENR) and CD54 + /PSA-NCAM - -reduced (RED) cell fractions. Cells were sorted using the MACSQuant Tyto cell sorter to maximize target cell purity. Replated fractions reveal that pigmented cells can be efficiently enriched with the dual marker strategy. (E) CD54 + /PSA-NCAM - sorting of frozen and freshly harvested cells consistently yielded a target fraction of high purity. Circles show single re-analysis measurements, solid points their average. Scale bars: 100 µm (D), 50 µm (C).
    Flow Cytometry Based Macs Marker Screen, supplied by Miltenyi Biotec, used in various techniques. Bioz Stars score: 97/100, based on 1 PubMed citations. ZERO BIAS - scores, article reviews, protocol conditions and more
    https://www.bioz.com/product/human+version+02/MACS+Marker+Screen%2C+anti-human%2C+version+02/bio_rxiv__2024__10__15__618147-222-21-29
    Average 97 stars, based on 1 article reviews
    flow cytometry based macs marker screen - by Bioz Stars, 2026-10
    97/100 stars
      Buy from Supplier

    97
    Miltenyi Biotec plates
    Identification and validation of cell surface sorting markers for iPSC-derived P1 RPE cells (A) P1 RPE cells were screened for expression of 371 antibodies directed against cell surface markers using flow <t>cytometry.</t> Hits were identified based on correlation to side scatter (SSC) intensity as proxy for pigmentation, here shown for CD54 (ICAM-1) (positive correlation) and PSA-NCAM (negative correlation). (B) Combinatorial staining for CD54 and PSA-NCAM reliably discriminates SSC-low non-target (unpigmented, backgated in blue) and SSC-high target cells (pigmented, backgated in orange). (C) Immunofluorescent staining of RPE cells in culture shows cells expressing PSA-NCAM but little CD54 mostly in regions lacking pigmentation and proper cobblestone morphology (areas highlighted by dashed lines). Co-expression of CD54 and PSA-NCAM appears to occur primarily in regions of intermediate pigmentation levels and mixed cobblestone morphology (area highlighted by solid line) (D) Flow scatter and corresponding transmitted light microscopy images for unsorted (UNS), CD54 + /PSA-NCAM - -enriched (ENR) and CD54 + /PSA-NCAM - -reduced (RED) cell fractions. Cells were sorted using the MACSQuant Tyto cell sorter to maximize target cell purity. Replated fractions reveal that pigmented cells can be efficiently enriched with the dual marker strategy. (E) CD54 + /PSA-NCAM - sorting of frozen and freshly harvested cells consistently yielded a target fraction of high purity. Circles show single re-analysis measurements, solid points their average. Scale bars: 100 µm (D), 50 µm (C).
    Plates, supplied by Miltenyi Biotec, used in various techniques. Bioz Stars score: 97/100, based on 1 PubMed citations. ZERO BIAS - scores, article reviews, protocol conditions and more
    https://www.bioz.com/product/human+version+02/MACS+Marker+Screen%2C+anti-human%2C+version+02/pm36965292-68-10-17
    Average 97 stars, based on 1 article reviews
    plates - by Bioz Stars, 2026-10
    97/100 stars
      Buy from Supplier

    97
    Miltenyi Biotec human version 02
    Identification and validation of cell surface sorting markers for iPSC-derived P1 RPE cells (A) P1 RPE cells were screened for expression of 371 antibodies directed against cell surface markers using flow <t>cytometry.</t> Hits were identified based on correlation to side scatter (SSC) intensity as proxy for pigmentation, here shown for CD54 (ICAM-1) (positive correlation) and PSA-NCAM (negative correlation). (B) Combinatorial staining for CD54 and PSA-NCAM reliably discriminates SSC-low non-target (unpigmented, backgated in blue) and SSC-high target cells (pigmented, backgated in orange). (C) Immunofluorescent staining of RPE cells in culture shows cells expressing PSA-NCAM but little CD54 mostly in regions lacking pigmentation and proper cobblestone morphology (areas highlighted by dashed lines). Co-expression of CD54 and PSA-NCAM appears to occur primarily in regions of intermediate pigmentation levels and mixed cobblestone morphology (area highlighted by solid line) (D) Flow scatter and corresponding transmitted light microscopy images for unsorted (UNS), CD54 + /PSA-NCAM - -enriched (ENR) and CD54 + /PSA-NCAM - -reduced (RED) cell fractions. Cells were sorted using the MACSQuant Tyto cell sorter to maximize target cell purity. Replated fractions reveal that pigmented cells can be efficiently enriched with the dual marker strategy. (E) CD54 + /PSA-NCAM - sorting of frozen and freshly harvested cells consistently yielded a target fraction of high purity. Circles show single re-analysis measurements, solid points their average. Scale bars: 100 µm (D), 50 µm (C).
    Human Version 02, supplied by Miltenyi Biotec, used in various techniques. Bioz Stars score: 97/100, based on 1 PubMed citations. ZERO BIAS - scores, article reviews, protocol conditions and more
    https://www.bioz.com/product/human+version+02/MACS+Marker+Screen%2C+anti-human%2C+version+02/pm36965292-50-3-6
    Average 97 stars, based on 1 article reviews
    human version 02 - by Bioz Stars, 2026-10
    97/100 stars
      Buy from Supplier

    97
    Miltenyi Biotec macs marker screen
    Identification and validation of cell surface sorting markers for iPSC-derived P1 RPE cells (A) P1 RPE cells were screened for expression of 371 antibodies directed against cell surface markers using flow <t>cytometry.</t> Hits were identified based on correlation to side scatter (SSC) intensity as proxy for pigmentation, here shown for CD54 (ICAM-1) (positive correlation) and PSA-NCAM (negative correlation). (B) Combinatorial staining for CD54 and PSA-NCAM reliably discriminates SSC-low non-target (unpigmented, backgated in blue) and SSC-high target cells (pigmented, backgated in orange). (C) Immunofluorescent staining of RPE cells in culture shows cells expressing PSA-NCAM but little CD54 mostly in regions lacking pigmentation and proper cobblestone morphology (areas highlighted by dashed lines). Co-expression of CD54 and PSA-NCAM appears to occur primarily in regions of intermediate pigmentation levels and mixed cobblestone morphology (area highlighted by solid line) (D) Flow scatter and corresponding transmitted light microscopy images for unsorted (UNS), CD54 + /PSA-NCAM - -enriched (ENR) and CD54 + /PSA-NCAM - -reduced (RED) cell fractions. Cells were sorted using the MACSQuant Tyto cell sorter to maximize target cell purity. Replated fractions reveal that pigmented cells can be efficiently enriched with the dual marker strategy. (E) CD54 + /PSA-NCAM - sorting of frozen and freshly harvested cells consistently yielded a target fraction of high purity. Circles show single re-analysis measurements, solid points their average. Scale bars: 100 µm (D), 50 µm (C).
    Macs Marker Screen, supplied by Miltenyi Biotec, used in various techniques. Bioz Stars score: 97/100, based on 1 PubMed citations. ZERO BIAS - scores, article reviews, protocol conditions and more
    https://www.bioz.com/product/human+version+02/MACS+Marker+Screen%2C+anti-human%2C+version+02/pm35758160-378-9-17
    Average 97 stars, based on 1 article reviews
    macs marker screen - by Bioz Stars, 2026-10
    97/100 stars
      Buy from Supplier

    Image Search Results


    Identification and validation of cell surface sorting markers for iPSC-derived P1 RPE cells (A) P1 RPE cells were screened for expression of 371 antibodies directed against cell surface markers using flow cytometry. Hits were identified based on correlation to side scatter (SSC) intensity as proxy for pigmentation, here shown for CD54 (ICAM-1) (positive correlation) and PSA-NCAM (negative correlation). (B) Combinatorial staining for CD54 and PSA-NCAM reliably discriminates SSC-low non-target (unpigmented, backgated in blue) and SSC-high target cells (pigmented, backgated in orange). (C) Immunofluorescent staining of RPE cells in culture shows cells expressing PSA-NCAM but little CD54 mostly in regions lacking pigmentation and proper cobblestone morphology (areas highlighted by dashed lines). Co-expression of CD54 and PSA-NCAM appears to occur primarily in regions of intermediate pigmentation levels and mixed cobblestone morphology (area highlighted by solid line) (D) Flow scatter and corresponding transmitted light microscopy images for unsorted (UNS), CD54 + /PSA-NCAM - -enriched (ENR) and CD54 + /PSA-NCAM - -reduced (RED) cell fractions. Cells were sorted using the MACSQuant Tyto cell sorter to maximize target cell purity. Replated fractions reveal that pigmented cells can be efficiently enriched with the dual marker strategy. (E) CD54 + /PSA-NCAM - sorting of frozen and freshly harvested cells consistently yielded a target fraction of high purity. Circles show single re-analysis measurements, solid points their average. Scale bars: 100 µm (D), 50 µm (C).

    Journal: bioRxiv

    Article Title: Extensive monolayer formation depends on a subpopulation of transplanted human iPSC-derived RPE cells

    doi: 10.1101/2024.10.15.618147

    Figure Lengend Snippet: Identification and validation of cell surface sorting markers for iPSC-derived P1 RPE cells (A) P1 RPE cells were screened for expression of 371 antibodies directed against cell surface markers using flow cytometry. Hits were identified based on correlation to side scatter (SSC) intensity as proxy for pigmentation, here shown for CD54 (ICAM-1) (positive correlation) and PSA-NCAM (negative correlation). (B) Combinatorial staining for CD54 and PSA-NCAM reliably discriminates SSC-low non-target (unpigmented, backgated in blue) and SSC-high target cells (pigmented, backgated in orange). (C) Immunofluorescent staining of RPE cells in culture shows cells expressing PSA-NCAM but little CD54 mostly in regions lacking pigmentation and proper cobblestone morphology (areas highlighted by dashed lines). Co-expression of CD54 and PSA-NCAM appears to occur primarily in regions of intermediate pigmentation levels and mixed cobblestone morphology (area highlighted by solid line) (D) Flow scatter and corresponding transmitted light microscopy images for unsorted (UNS), CD54 + /PSA-NCAM - -enriched (ENR) and CD54 + /PSA-NCAM - -reduced (RED) cell fractions. Cells were sorted using the MACSQuant Tyto cell sorter to maximize target cell purity. Replated fractions reveal that pigmented cells can be efficiently enriched with the dual marker strategy. (E) CD54 + /PSA-NCAM - sorting of frozen and freshly harvested cells consistently yielded a target fraction of high purity. Circles show single re-analysis measurements, solid points their average. Scale bars: 100 µm (D), 50 µm (C).

    Article Snippet: P1 RPE cells derived from CRTD1 iPSC were screened for expression of 371 antibodies directed against cell surface markers using the flow cytometry-based MACS® Marker Screen, anti-human, version 01 (Miltenyi Biotec, 130-110-055) according to the manufacturer’s instructions.

    Techniques: Biomarker Discovery, Derivative Assay, Expressing, Flow Cytometry, Staining, Light Microscopy, Marker

    CD54 + /PSA-NCAM - RPE cells show increased monolayer formation after transplantation. (A – C) Flat-mounted eyecups that received P1 RPE single cell suspensions which were either unsorted (UNS; A), enriched (ENR, B), or reduced (RED, C) in CD54 + /PSA-NCAM - cells show large areas of donor cells identified by Human Nuclei staining (graft region outlined with dotted lines). While in UNS (A, A’) and RED (C) samples the proportion of area with cell clusters (visible through intense Human Nuclei staining) is high, in ENR transplanted retinas the proportion of monolayer with typical cobblestone morphology as seen by staining for F-actin is high (B, B’, B’’). Human nuclei visibility in properly structured monolayers is concealed due to high pigmentation of donor cells (B’’; for single z-planes see figures S4E and F), but better visible at monolayer edges (B’). Magnification of an RPE-depleted area without donor cells is shown in C’. (D) Outlines of monolayer cells from B’’ as detected with the REShAPE tool( Ortolan et al , 2022 ) show the possibility to analyse the grafts in flatmount view. (E-G) REShAPE analysis of the flatmounts A-C (corresponding REShAPE cell outline maps see figure S4G-I). (E) reveals a highly increased number of monolayer cells in the ENR graft in comparison to UNS or RED (UNS: 7453, ENR: 37607, RED: 6921). ENR monolayer cells on average appear larger than UNS or RED monolayer cells (F; mean areas: UNS 57 µm 2 , ENR 79 µm 2 , RED 55 µm 2 , violin plots of all cells detected with overlaid box-plots showing median and 25% quartiles, black lines showing the mean). In all three conditions human monolayer cells have mostly 5 or 6 neighboring cells, with the ENR graft having the highest ratio of cells with 5-7 neighbors (G; UNS: 67%, ENR: 82%, RED: 69%). (H) Monolayers formed in all conditions show a polarized morphology with basal collagen IV (COL4) and apical ATPase (ATP1A1) expression. Human nuclei are located basally, while pigmentation (dark in DIC images) appears mainly apically. Large, highly pigmented, round structures are frequently detected in clusters (see also A’) and sometimes in monolayer areas, likely representing pigment-filled macrophages (compare also figure S5A). (I, J) Quantification of monolayer proportion after transplantation of RPE cells from two separate differentiation rounds. While in both rounds the CD54 + /PSA-NCAM - ENR donor cell fractions robustly generated similarly high proportions of monolayer (ENR - I : 82.5% ± 3.5%; n=7; ENR – J: 69.5% ± 6.9%; n=4), the amount of monolayer generated by UNS (UNS - I: 67.3% ± 3.5%; n=5; UNS - J: 23.1% ± 3.3%, n=7) and RED cell fractions (RED - I: 55.2% ± 8.1%; n=6; RED - J: 6.9% ± 1.3%, n=9; Kruskal-Wallis with pairwise Wilcoxon test) strongly varied, correlating with different amounts of CD54 + /PSA-NCAM - cell purity within the different fractions (see also figure S4A for purity data related to and figure S4B for purity data related to ). (K) Quantification of monolayer proportion after transplantation of RPE cells from a third differentiation round, sorted with conventional flow cytometry (UNS: 17.9% ± 3.8%, n = 5; ENR: 55.3% ± 12.2%, n = 4; RED: 21.5% ± 7.2%, n = 4; Kruskal-Wallis with pairwise Wilcoxon test). Scale bars, 500 µm (A, B, C), 50 µm (A’, B’, B’’, C’, D) and 20 µm (H). Data are represented as mean ± SEM.

    Journal: bioRxiv

    Article Title: Extensive monolayer formation depends on a subpopulation of transplanted human iPSC-derived RPE cells

    doi: 10.1101/2024.10.15.618147

    Figure Lengend Snippet: CD54 + /PSA-NCAM - RPE cells show increased monolayer formation after transplantation. (A – C) Flat-mounted eyecups that received P1 RPE single cell suspensions which were either unsorted (UNS; A), enriched (ENR, B), or reduced (RED, C) in CD54 + /PSA-NCAM - cells show large areas of donor cells identified by Human Nuclei staining (graft region outlined with dotted lines). While in UNS (A, A’) and RED (C) samples the proportion of area with cell clusters (visible through intense Human Nuclei staining) is high, in ENR transplanted retinas the proportion of monolayer with typical cobblestone morphology as seen by staining for F-actin is high (B, B’, B’’). Human nuclei visibility in properly structured monolayers is concealed due to high pigmentation of donor cells (B’’; for single z-planes see figures S4E and F), but better visible at monolayer edges (B’). Magnification of an RPE-depleted area without donor cells is shown in C’. (D) Outlines of monolayer cells from B’’ as detected with the REShAPE tool( Ortolan et al , 2022 ) show the possibility to analyse the grafts in flatmount view. (E-G) REShAPE analysis of the flatmounts A-C (corresponding REShAPE cell outline maps see figure S4G-I). (E) reveals a highly increased number of monolayer cells in the ENR graft in comparison to UNS or RED (UNS: 7453, ENR: 37607, RED: 6921). ENR monolayer cells on average appear larger than UNS or RED monolayer cells (F; mean areas: UNS 57 µm 2 , ENR 79 µm 2 , RED 55 µm 2 , violin plots of all cells detected with overlaid box-plots showing median and 25% quartiles, black lines showing the mean). In all three conditions human monolayer cells have mostly 5 or 6 neighboring cells, with the ENR graft having the highest ratio of cells with 5-7 neighbors (G; UNS: 67%, ENR: 82%, RED: 69%). (H) Monolayers formed in all conditions show a polarized morphology with basal collagen IV (COL4) and apical ATPase (ATP1A1) expression. Human nuclei are located basally, while pigmentation (dark in DIC images) appears mainly apically. Large, highly pigmented, round structures are frequently detected in clusters (see also A’) and sometimes in monolayer areas, likely representing pigment-filled macrophages (compare also figure S5A). (I, J) Quantification of monolayer proportion after transplantation of RPE cells from two separate differentiation rounds. While in both rounds the CD54 + /PSA-NCAM - ENR donor cell fractions robustly generated similarly high proportions of monolayer (ENR - I : 82.5% ± 3.5%; n=7; ENR – J: 69.5% ± 6.9%; n=4), the amount of monolayer generated by UNS (UNS - I: 67.3% ± 3.5%; n=5; UNS - J: 23.1% ± 3.3%, n=7) and RED cell fractions (RED - I: 55.2% ± 8.1%; n=6; RED - J: 6.9% ± 1.3%, n=9; Kruskal-Wallis with pairwise Wilcoxon test) strongly varied, correlating with different amounts of CD54 + /PSA-NCAM - cell purity within the different fractions (see also figure S4A for purity data related to and figure S4B for purity data related to ). (K) Quantification of monolayer proportion after transplantation of RPE cells from a third differentiation round, sorted with conventional flow cytometry (UNS: 17.9% ± 3.8%, n = 5; ENR: 55.3% ± 12.2%, n = 4; RED: 21.5% ± 7.2%, n = 4; Kruskal-Wallis with pairwise Wilcoxon test). Scale bars, 500 µm (A, B, C), 50 µm (A’, B’, B’’, C’, D) and 20 µm (H). Data are represented as mean ± SEM.

    Article Snippet: P1 RPE cells derived from CRTD1 iPSC were screened for expression of 371 antibodies directed against cell surface markers using the flow cytometry-based MACS® Marker Screen, anti-human, version 01 (Miltenyi Biotec, 130-110-055) according to the manufacturer’s instructions.

    Techniques: Transplantation Assay, Staining, Comparison, Expressing, Generated, Flow Cytometry