|
Addgene inc
u6 sgrna2 U6 Sgrna2, supplied by Addgene inc, used in various techniques. Bioz Stars score: 93/100, based on 1 PubMed citations. ZERO BIAS - scores, article reviews, protocol conditions and more https://www.bioz.com/result/u6 sgrna2/product/Addgene inc Average 93 stars, based on 1 article reviews
u6 sgrna2 - by Bioz Stars,
2026-03
93/100 stars
|
Buy from Supplier |
|
Addgene inc
sgrna2 Sgrna2, supplied by Addgene inc, used in various techniques. Bioz Stars score: 93/100, based on 1 PubMed citations. ZERO BIAS - scores, article reviews, protocol conditions and more https://www.bioz.com/result/sgrna2/product/Addgene inc Average 93 stars, based on 1 article reviews
sgrna2 - by Bioz Stars,
2026-03
93/100 stars
|
Buy from Supplier |
|
Addgene inc
px330 ufsp2 sgrna2  Px330 Ufsp2 Sgrna2, supplied by Addgene inc, used in various techniques. Bioz Stars score: 93/100, based on 1 PubMed citations. ZERO BIAS - scores, article reviews, protocol conditions and more https://www.bioz.com/result/px330 ufsp2 sgrna2/product/Addgene inc Average 93 stars, based on 1 article reviews
px330 ufsp2 sgrna2 - by Bioz Stars,
2026-03
93/100 stars
|
Buy from Supplier |
|
Addgene inc
sgrna 2 Sgrna 2, supplied by Addgene inc, used in various techniques. Bioz Stars score: 91/100, based on 1 PubMed citations. ZERO BIAS - scores, article reviews, protocol conditions and more https://www.bioz.com/result/sgrna 2/product/Addgene inc Average 91 stars, based on 1 article reviews
sgrna 2 - by Bioz Stars,
2026-03
91/100 stars
|
Buy from Supplier |
|
Addgene inc
ipo13b sgrna2  Ipo13b Sgrna2, supplied by Addgene inc, used in various techniques. Bioz Stars score: 92/100, based on 1 PubMed citations. ZERO BIAS - scores, article reviews, protocol conditions and more https://www.bioz.com/result/ipo13b sgrna2/product/Addgene inc Average 92 stars, based on 1 article reviews
ipo13b sgrna2 - by Bioz Stars,
2026-03
92/100 stars
|
Buy from Supplier |
|
Addgene inc
plr06 pguide b2m sgrna2 Plr06 Pguide B2m Sgrna2, supplied by Addgene inc, used in various techniques. Bioz Stars score: 93/100, based on 1 PubMed citations. ZERO BIAS - scores, article reviews, protocol conditions and more https://www.bioz.com/result/plr06 pguide b2m sgrna2/product/Addgene inc Average 93 stars, based on 1 article reviews
plr06 pguide b2m sgrna2 - by Bioz Stars,
2026-03
93/100 stars
|
Buy from Supplier |
|
Addgene inc
u6 sgrna2 plasmid 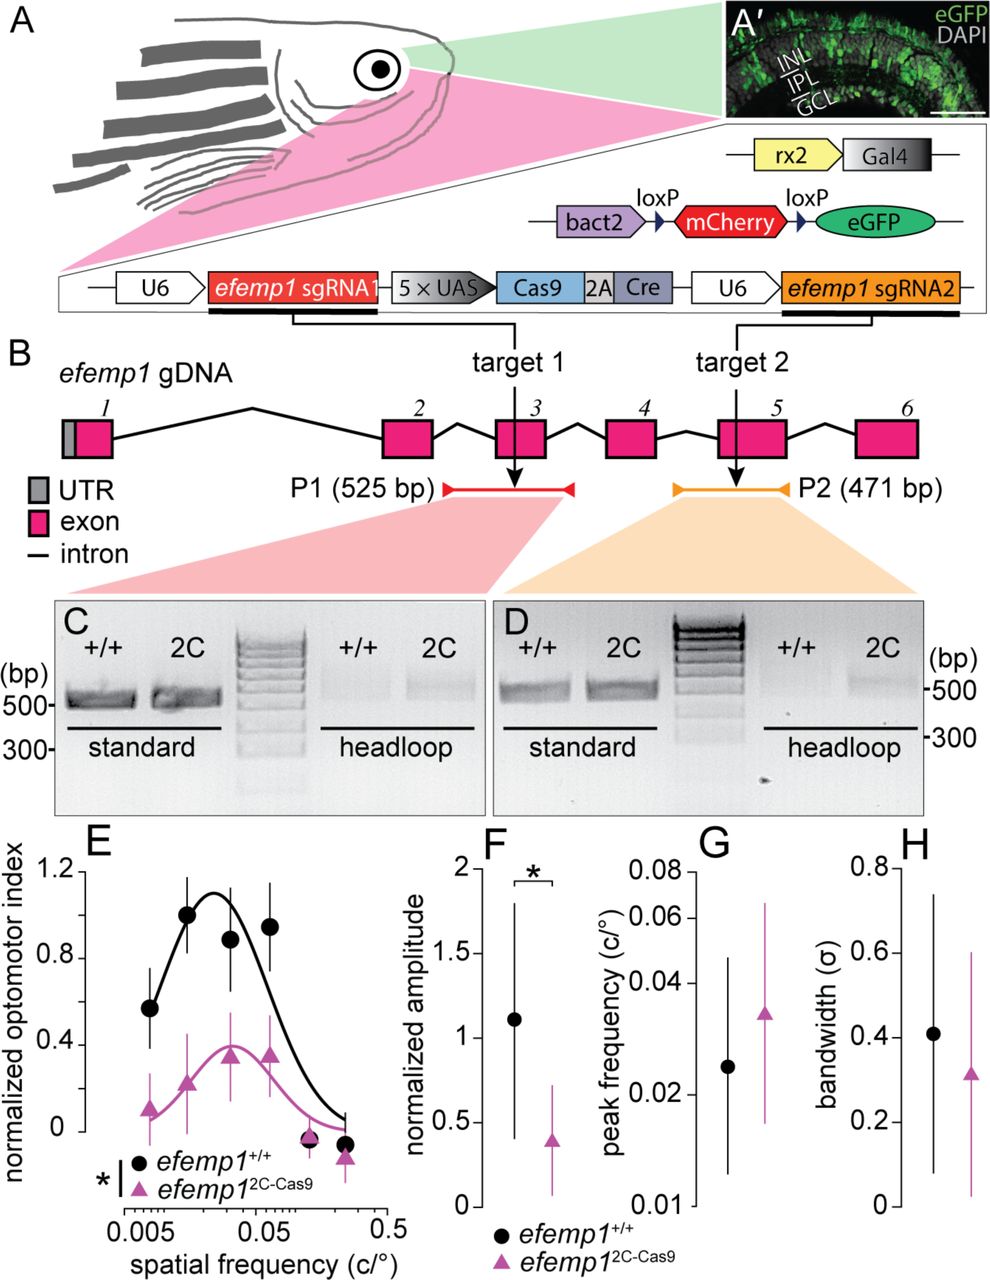 U6 Sgrna2 Plasmid, supplied by Addgene inc, used in various techniques. Bioz Stars score: 92/100, based on 1 PubMed citations. ZERO BIAS - scores, article reviews, protocol conditions and more https://www.bioz.com/result/u6 sgrna2 plasmid/product/Addgene inc Average 92 stars, based on 1 article reviews
u6 sgrna2 plasmid - by Bioz Stars,
2026-03
92/100 stars
|
Buy from Supplier |
|
Addgene inc
pagm4723 plasmid Pagm4723 Plasmid, supplied by Addgene inc, used in various techniques. Bioz Stars score: 91/100, based on 1 PubMed citations. ZERO BIAS - scores, article reviews, protocol conditions and more https://www.bioz.com/result/pagm4723 plasmid/product/Addgene inc Average 91 stars, based on 1 article reviews
pagm4723 plasmid - by Bioz Stars,
2026-03
91/100 stars
|
Buy from Supplier |
|
Addgene inc
lenticrispr sgrna egfp  Lenticrispr Sgrna Egfp, supplied by Addgene inc, used in various techniques. Bioz Stars score: 94/100, based on 1 PubMed citations. ZERO BIAS - scores, article reviews, protocol conditions and more https://www.bioz.com/result/lenticrispr sgrna egfp/product/Addgene inc Average 94 stars, based on 1 article reviews
lenticrispr sgrna egfp - by Bioz Stars,
2026-03
94/100 stars
|
Buy from Supplier |
|
Addgene inc
px459 sgrna2 vectors Px459 Sgrna2 Vectors, supplied by Addgene inc, used in various techniques. Bioz Stars score: 93/100, based on 1 PubMed citations. ZERO BIAS - scores, article reviews, protocol conditions and more https://www.bioz.com/result/px459 sgrna2 vectors/product/Addgene inc Average 93 stars, based on 1 article reviews
px459 sgrna2 vectors - by Bioz Stars,
2026-03
93/100 stars
|
Buy from Supplier |
|
Addgene inc
pmd2 g didier trono lab addgene Pmd2 G Didier Trono Lab Addgene, supplied by Addgene inc, used in various techniques. Bioz Stars score: 86/100, based on 1 PubMed citations. ZERO BIAS - scores, article reviews, protocol conditions and more https://www.bioz.com/result/pmd2 g didier trono lab addgene/product/Addgene inc Average 86 stars, based on 1 article reviews
pmd2 g didier trono lab addgene - by Bioz Stars,
2026-03
86/100 stars
|
Buy from Supplier |
|
Addgene inc
sgrna sgrna2 Sgrna Sgrna2, supplied by Addgene inc, used in various techniques. Bioz Stars score: 90/100, based on 1 PubMed citations. ZERO BIAS - scores, article reviews, protocol conditions and more https://www.bioz.com/result/sgrna sgrna2/product/Addgene inc Average 90 stars, based on 1 article reviews
sgrna sgrna2 - by Bioz Stars,
2026-03
90/100 stars
|
Buy from Supplier |
Image Search Results
Journal: Autophagy
Article Title: The Epstein-Barr virus deubiquitinase BPLF1 regulates stress-induced ribosome UFMylation and reticulophagy
doi: 10.1080/15548627.2024.2440846
Figure Lengend Snippet: Reagents used in this paper.
Article Snippet:
Techniques: Recombinant, Diagnostic Assay, Transfection, Mutagenesis, Cloning, cDNA Synthesis, SYBR Green Assay, DC Protein Assay, Protein Purification, Knock-Out, Plasmid Preparation
Journal: bioRxiv
Article Title: Importin 13-dependent Axon Diameter Growth Regulates Conduction Speeds along Myelinated CNS Axons
doi: 10.1101/2023.05.19.541431
Figure Lengend Snippet: (A) Brightfield images of control and ue57 mutant zebrafish at 5 dpf, depicting normal growth and gross morphology. (B) The Mauthner axon (somite 15) labelled using Tg(hspGFF62A:Gal4); Tg(UAS:mRFP) in control and ue57 mutant zebrafish illustrates the smaller axon diameter in mutants at 5dpf. Labelling of myelin with Tg(mbp:eGFPCAAX) shows that the Mauthner axon is myelinated (white arrows). Magnification of the mutant Mauthner axon (region within dashed square) is shown in (B’). (C) Mauthner axon diameter measured at somite 15 using the Tg(hspGFF62A:Gal4); Tg(UAS:mRFP) reporter (Two-tailed unpaired t-test, ****p<0.0001). (D) In a 20 min open field test at 5 dpf, ue57 mutant zebrafish spend significantly less time swimming than controls (Two-tailed Mann-Whitney test, ****P<0.0001, n= 144 ctrl, n = 31 ue57 , from 4 different clutches of fish). (E) A region of exon 21 (last exon) of the ipo13b gene where a C>T base pair change (highlighted in red) was identified in ue57 mutants. (F) This base pair change results in the introduction of a premature stop codon in the highly conserved C-terminal region of importin 13b, predicted to result in a truncated protein missing the last 30 amino acids. (G) Overview of a region in exon 3 of the ipo13b gene indicating the site targeted with an sgRNA for cas9-mediated DNA cleavage (PAM sequence highlighted in red), and the resulting mutations in the ue76 and ue77 mutant lines. (H) The mutations disrupt key residues previously shown to bind Ran-GTP (asterisks) , and result in frame shifts followed by premature stop codons. (I) Representative images of a lateral view of the Mauthner axon (somite 15) labeled using the Tg(hspGFF62A:Gal4); Tg(UAS:GFP) reporter in a 4 dpf control, ipo13b ue , ipo13b ue and ipo13b ue zebrafish and 5 dpf ipo13b ue /ue and ipo13b ue /ue zebrafish, with quantification of axon diameter shown in (J-M) (****p<0.0001 Two-tailed unpaired t-test (J-L) or one-way ANOVA with Tukey’s multiple comparisons test (M)). For all bar graphs, each point represents an individual animal. Scale bars: 300 µm (A), 20 µm (B,B’), 10 µm (I) .
Article Snippet: The annealed oligos were then ligated into U6 promotor-based cassettes: ipo13b sgRNA1 into pU6a:sgRNA#1 (Addgene #64245),
Techniques: Control, Mutagenesis, Two Tailed Test, MANN-WHITNEY, Sequencing, Labeling

Journal: bioRxiv
Article Title: Importin 13-dependent Axon Diameter Growth Regulates Conduction Speeds along Myelinated CNS Axons
doi: 10.1101/2023.05.19.541431
Figure Lengend Snippet: (A) Representative live-imaging time course of the Mauthner axon (somite 15) from 2 dpf – 7 dpf in a control and ipo13b ue zebrafish labeled using Tg(hspGFF62A:Gal4); Tg(UAS:GFP). (B) Quantification of Mauthner axon diameter growth followed for the same axons at somite 15 from 2 – 7 dpf (n=7 wildtype, 17 heterozygous, 6 mutants, 2-way ANOVA with Tukey’s multiple comparisons test, **p<0.01, ***p<0.001, ****p<0.0001, wt and het are not significantly different from one another). (C) Representative live-images of the entire Mauthner neuron in control and ipo13b ue57 zebrafish at 3 dpf, which were used to measure axon length in D. Area boxed in magenta is enlarged in (C’). (D) Quantification of the entire length of the Mauthner axon at 3 dpf (Two-tailed unpaired t-test with Welch’s correction, p=0.5992). (E) Representative live-imaging of the Mauthner neuron at 4 dpf in control and ipo13b ue zebrafish labelled using the transgenic line Tg(hspGFF62A:Gal4); Tg(UAS:mem-Scarlet). Bracket indicates the position of the cell body and arrow points to the axon. (F) Quantification of the Mauthner cell body area at 4 dpf (Two-tailed unpaired t-test, p=0.0638). (G) Schematic overview of the electrophysiological set-up for measuring conduction velocity along the Mauthner axon. (H) Example traces of Mauthner whole-cell current clamp recording showing action potentials generated in response to Mauthner axon extracellular stimulation. There is a longer latency between the stimulus artifact and action potential peak in the mutants indicating a slower conduction velocity. (I) Conduction velocity measurements along Mauthner axon from 2 dpf to 5 dpf in ipo13b ue animals and control siblings (2-way ANOVA with Sidak’s multiple comparisons test, **p=0.0025 (3dpf), 0.0071 (4dpf), ****p<0.0001). MiMi (J) or Mid3i (K) neuron (top panel) and its axon (somite 15) in control (middle panel) and ipo13b ue (bottom panel) animals labelled using the transgenic reporter Tg(hspGFF62A:Gal4); Tg(UAS:mem-Scarlet). (L) Quantification of MiMi axon diameter at 5 dpf (Two-tailed unpaired t-test, ***p<0.0003). (M) Quantification of Mid3i axon diameter at 5 dpf (Two-tailed unpaired t-test, *p<0.016). For all bar graphs, each point represents an individual animal. Scale bars: 10 µm (A, E, J, K), 100 µm (C), 50 µm (C’).
Article Snippet: The annealed oligos were then ligated into U6 promotor-based cassettes: ipo13b sgRNA1 into pU6a:sgRNA#1 (Addgene #64245),
Techniques: Imaging, Control, Labeling, Two Tailed Test, Transgenic Assay, Generated

Journal: bioRxiv
Article Title: Importin 13-dependent Axon Diameter Growth Regulates Conduction Speeds along Myelinated CNS Axons
doi: 10.1101/2023.05.19.541431
Figure Lengend Snippet: (A) Representative electron micrographs of cross sections of the ventral spinal cord at 7 dpf in control and (B) ipo13b ue animals. The Mauthner axon is labelled ‘M’. (C) Quantification of Mauthner axon diameter from 7 dpf electron micrographs (Two-tailed unpaired t-test with Welch’s correction, ****p<0.0001). (D) Mean diameter for the 30 largest axons in each hemi ventral spinal cord at 7 dpf, excluding Mauthner (Two-tailed unpaired t-test with Welch’s correction, **p=0.0061). (E) Representative electron micrographs of cross sections of the dorsal spinal cord at 7 dpf in control and (F) ipo13b ue zebrafish. (G) Number of myelinated axons in the dorsal and ventral tracts of each hemi spinal cord at 7 dpf (Two-tailed unpaired t-test, ****p<0.0001). (H) Distribution of axon diameters for the 30 largest axons in each hemi ventral spinal cord at 7 dpf, excluding Mauthner (n=7 control and 8 mutants, the distributions are significantly different, Kolmogorov-Smirnov test, ****p<0.0001). (I) Distribution of axon diameters for the 30 largest axons in each hemi dorsal spinal cord at 7 dpf (n=7 control and 8 mutants, distributions are significantly different, Kolmogorov-Smirnov test, **p=0.0030). Scale bars = 1 µm.
Article Snippet: The annealed oligos were then ligated into U6 promotor-based cassettes: ipo13b sgRNA1 into pU6a:sgRNA#1 (Addgene #64245),
Techniques: Control, Two Tailed Test

Journal: bioRxiv
Article Title: Importin 13-dependent Axon Diameter Growth Regulates Conduction Speeds along Myelinated CNS Axons
doi: 10.1101/2023.05.19.541431
Figure Lengend Snippet: (A-B) Representative electron micrographs of a cross section of the Mauthner axon in the ventral spinal cord at 7 dpf in control and ipo13b ue57 zebrafish. A region of each axon is magnified in A’ and B’ to allow visualization of the distribution of neurofilaments. (C) Density of neurofilaments in control and ipo13b ue mutant Mauthner axons at 7 dpf (Two-tailed unpaired t-test, ***p=0.0006). (D) Nearest neighbour distribution of neurofilaments in the Mauthner axon at 7 dpf, showing a shift to closer nearest neighbours in the ipo13b ue mutants. For all graphs, each point represents an individual animal. Scale bars: 500nm (A), 100nm (B).
Article Snippet: The annealed oligos were then ligated into U6 promotor-based cassettes: ipo13b sgRNA1 into pU6a:sgRNA#1 (Addgene #64245),
Techniques: Control, Mutagenesis, Two Tailed Test

Journal: bioRxiv
Article Title: Importin 13-dependent Axon Diameter Growth Regulates Conduction Speeds along Myelinated CNS Axons
doi: 10.1101/2023.05.19.541431
Figure Lengend Snippet: (A) Schematic overview of the transgenic CRISPR/Cas9 strategy used to generate neuron specific ipo13b mutants. (B) Representative images of the Mauthner axon (somite 15) in the neuron specific ipo13b mutants (cas9+sgRNA) and control animals (cas9 or sgRNA only) labelled using Tg(hspGFF62A:Gal4); Tg(UAS:mRFP). (C) Quantification of Mauthner axon diameter in the neuron specific ipo13b mutants (Kruskal-Wallis test with Dunn’s multiple comparisons test, ****p<0.0001). Each point represents an individual Mauthner axon. Scale bars = 10 µm.
Article Snippet: The annealed oligos were then ligated into U6 promotor-based cassettes: ipo13b sgRNA1 into pU6a:sgRNA#1 (Addgene #64245),
Techniques: Transgenic Assay, CRISPR, Control

Journal: bioRxiv
Article Title: Importin 13-dependent Axon Diameter Growth Regulates Conduction Speeds along Myelinated CNS Axons
doi: 10.1101/2023.05.19.541431
Figure Lengend Snippet: (A) Super-resolution imaging of Mauthner axons labelled using the transgenic line Tg(hspGFF62A:Gal4); Tg(UAS:RFP) alongside whole-cell patch clamp traces showing action potentials generated in response to extracellular stimulation of the same axons (B). (C) Conduction velocity along Mauthner axon plotted against axon diameter for controls axons (3-5dpf) and neuronal specific ipo13b mutant axons (5 dpf). Control points are fitted with a linear regression line (R=0.4959 for control, neuronal specific ipo13 mutants are not significantly different from controls by simple linear regression test). (D) Conduction velocity measurements along Mauthner axon at 5 dpf in neuronal specific ipo13b mutant animals and control siblings (Mann-Whitney Test, ***p=0.0002). (E) Axon diameter measurements for the same axons as in (D) (Mann-Whitney Test, ****p<0.0001). (F) The success rate of action potential firing by the Mauthner neuron in response to 10 stimulations at 300 Hz, 500 Hz and 1000 Hz (no significant differences using mixed-effects analysis with Sidak’s multiple comparisons test, n=5 3dpf controls, 5 4dpf controls, 6 5dpf controls, 10 ipo13b ue mutants, 11 neuronal specific ipo13b mutants). (G) Resting membrane potential in control and neuronal specific ipo13b mutant Mauthner neurons (no significant differences, Two-tailed unpaired t-test). (H) Depiction of three consecutive action potentials, which have slight variations in their latency of arrival. This variation is referred to as jitter. (I) The precision of action potential arrival (jitter) along Mauthner axon (no significant differences, one-way ANOVA with Tukey’s multiple comparisons test). For all bar graphs, and C, each point represents an individual animal. Scale bars = 10 µm.
Article Snippet: The annealed oligos were then ligated into U6 promotor-based cassettes: ipo13b sgRNA1 into pU6a:sgRNA#1 (Addgene #64245),
Techniques: Imaging, Transgenic Assay, Patch Clamp, Generated, Mutagenesis, Control, MANN-WHITNEY, Membrane, Two Tailed Test
Journal: bioRxiv
Article Title: EFEMP1 contributes to light-dependent ocular growth in zebrafish
doi: 10.1101/2023.12.18.572096
Figure Lengend Snippet: (A) The efemp1 2C-Cas9 fish were generated using 2C-Cas9 somatic gene editing. Mutant fish have three separate transgenes: Tg( rx2 : Gal4 ) × Tg( bact2 - loxP - mCherry - loxP - eGFP ) × Tg( UAS : Cas9T2ACre ; U6 : efemp1sgRNA1 ; U6 : efemp1sgRNA2 ). Co-expression of these transgenic elements result in expression of green fluorescence (eGFP) in zebrafish retina, indicative of successful Cas9 protein expression. (Aʹ) Representative retinal image from a 6 dpf fish. Nuclei stained with DAPI are shown in grey. INL, inner nuclear layer; IPL, inner plexiform layer; GCL, ganglion cell layer. Scale bar: 40 μm. (B) The universally expressed efemp1 sgRNA1 and sgRNA2 from the transgene binds with Cas9 nucleases and cuts exons 3 and 5 of the efemp1 genome DNA (gDNA), respectively. Standard PCR primers used for genotyping the target sites 1 and 2 amplified 525-(Product 1, P1; spinning from the introns before to after the exon 3) and 471-base pairs (bp; P2; spinning from the intron before to the end of exon 5) of DNA sequences, respectively. Products of headloop PCR are 23-bp longer for P1 and 20-bp longer for P2 due to the headloop tags in reverse primers. UTR, untranslated region. (C–D) Gel electrophoresis of the products from standard and headloop PCR for genotyping targeted sites 1 (C) and 2 (D) . In both images, the middle lanes show a 100-bp reference ladder; positions of 300 and 500 bp of size are indicated for both gel images. (E–H) Results of optomotor responses. Spatial-frequency tuning functions (E) for 5 dpf efemp1 +/+ (n = 14) and efemp1 2C-Cas9 fish (n = 13) are three-parameter log-Gaussian functions fit to the data by minimizing the least-square error. The fitted parameters, including (F) normalized amplitude, (G) peak frequency and (H) bandwidth, were compared between groups Group data are shown as mean ± SEM in (E) and mean with 95% confidence intervals in (F–H). * P < 0.05 ( F -test).
Article Snippet: The p UAS : Cas9T2ACre ; U6 : sgRNA1 ;
Techniques: Generated, Mutagenesis, Expressing, Transgenic Assay, Fluorescence, Staining, Amplification, Nucleic Acid Electrophoresis
Journal: BioMed Research International
Article Title: Efficient Mitochondrial Genome Editing by CRISPR/Cas9
doi: 10.1155/2015/305716
Figure Lengend Snippet: FLAG-NLS-Cas9 localizes to mitochondria. (a) Subcellular localization of FLAG-Cas9 assessed in the cytosolic (Cyt), mitochondrial (Mit), and nuclear (Nu) fractions of HEK-293T cells transfected with lentiCRISPR-sgRNA-eGFP#2 and monitored by Western blot. Glyceraldehyde 3-phosphate dehydrogenase (GAPDH) served as a cytosolic marker, poly(ADP-ribose) polymerase 1 (PARP1) served as a nuclear marker, and succinate dehydrogenase complex subunit A (SDHA) served as a mitochondrial marker. Ponceau staining of the blotted nitrocellulose membrane was presented in the bottom lane to visualize relative protein loading amounts. (b) Immunofluorescence images of FLAG-NLS-Cas9 demonstrating its localization to nucleus, cytoplasm, and mitochondria. HEK-293T cells were immunostained with mouse antibody to FLAG (green) 24 hours following transient transfection with FLAG-NLS-Cas9 construct. Mitochondria or nucleus was stained with mitotracker Red or DAPI, respectively. (c) Illustration of human mitochondrial DNA (mtDNA). Simplified view of mtDNA is presented to depict regions encoding peptides or tRNA for indicated amino acids. Filled triangles indicate sites targeted by gRNAs against Cox1 or Cox3. Arrows indicate primer annealing sites used for real-time PCR of Cox1 or Cox3 regions. (d) Quantification of copy numbers for Cox1, Cox3, and ND1 regions of mtDNA extracted from HEK-293T cells transiently transfected with lentiCRISPR-sgRNA-Cox1 and lentiCRISPR-sgRNA-Cox3 or lentiCRISPR-sgRNA-eGFP#2 as a control, determined by real-time quantitative PCR using primers listed in . GAPDH was used as an internal loading control ( n = 3 per group). Quantified data (d) are expressed as mean ± s.e.m., ∗∗∗ P < 0.001, unpaired two-tailed Student's t -test.
Article Snippet: LentiCRISPR and
Techniques: Transfection, Western Blot, Marker, Staining, Immunofluorescence, Construct, Real-time Polymerase Chain Reaction, Two Tailed Test

Journal: BioMed Research International
Article Title: Efficient Mitochondrial Genome Editing by CRISPR/Cas9
doi: 10.1155/2015/305716
Figure Lengend Snippet: Alterations in mitochondria-associated proteins following CRISPR/Cas9-mediated mtDNA editing. (a) Mitochondrial proteins in HEK-293T cells after CRISPR/Cas9-mediated cleavage of mtDNA at Cox1 and Cox3 loci as determined by Western blots using indicated antibodies. β -actin was used as a loading control. (b) Quantification of mitochondria proteins in HEK-293T cells transfected with lentiCRISPR-sgRNA-Cox1 + Cox3 or lentiCRISPR-sgRNA-eGFP#2 control as shown in panel (a) normalized to β -actin. (c) Illustration of human mtDNA. Specific loci targeted by lentiCRISPR-sgRNAs (Cox1, Cox2, Cox3, and ATP8/6) are indicated with filled triangles. (d) Representative Western blots showing differential alteration of mitochondrial proteins following cleavage of specific mtDNA loci mediated by indicated sgRNAs in HEK-293T cells. Quantified data (b) are expressed as mean ± s.e.m., ∗ P < 0.05, ∗∗ P < 0.01, and ∗∗∗ P < 0.001, unpaired two-tailed Student's t -test.
Article Snippet: LentiCRISPR and
Techniques: CRISPR, Western Blot, Transfection, Two Tailed Test

Journal: BioMed Research International
Article Title: Efficient Mitochondrial Genome Editing by CRISPR/Cas9
doi: 10.1155/2015/305716
Figure Lengend Snippet: Construction of mitochondria-targeted MTS-HA-Cas9. (a) Schematic illustration of mitochondria-targeting Cas9 (mitoCas9). Mitochondria-targeting sequence (MTS) and HA tag information are presented. (b) Expression of mitoCas9 in HEK-293T cells transiently transfected with MTS-HA-Cas9 construct determined by Western blots using HA antibody. β -actin was used as a loading control. (c) Subcellular localization of MTS-HA-Cas9 assessed in the cytosolic (Cyt), mitochondrial (Mit), and nuclear (Nu) fractions of HEK-293T cells transfected with lentiCRISPR-sgRNA-eGFP#2 and monitored by Western blot. GAPDH served as a cytosolic marker, PARP1 served as a nuclear marker, and SDHA served as a mitochondrial marker. (d) Representative immunofluorescence microscopic image of MTS-HA-Cas9 (HA, green) and CoxIV (red) subcellular distributions in HEK-293T cells transfected with MTS-HA-Cas9 construct. The merged image (yellow, right panel) shows colocalization of mitoCas9 and CoxIV. (e) Representative gel images of the PCR product of hU6-sgRMA-eGFP and hU6-sgRNA-Cox1 which were purified by gel extraction (bottom panel). Schematics of primers and lentiCRISPR-sgRNA templates used to amplify U6 promoter and respective sgRNA components for transfection (upper panel). (f) Quantification of copy numbers for Cox1, Cox3, and ND1 regions of mtDNA extracted from HEK-293T cells transiently transfected with indicated constructs (mitoCas9 is a plasmid, while U6-sgRNAs are PCR product.), determined by real-time quantitative PCR using primers listed in . GAPDH was used as an internal loading control ( n = 3 per group). Quantified data (b) are expressed as mean ± s.e.m., ∗∗∗ P < 0.001, analysis of variance (ANOVA) test followed by Student-Newman-Keuls post hoc analysis.
Article Snippet: LentiCRISPR and
Techniques: Sequencing, Expressing, Transfection, Construct, Western Blot, Marker, Immunofluorescence, Purification, Gel Extraction, Plasmid Preparation, Real-time Polymerase Chain Reaction

Journal: BioMed Research International
Article Title: Efficient Mitochondrial Genome Editing by CRISPR/Cas9
doi: 10.1155/2015/305716
Figure Lengend Snippet: MitoCas9-induced mtDNA damage leads to mitochondria dysfunction. (a) Quantification of copy numbers for ND1 region of mtDNA extracted from HEK-293T cells transiently transfected with indicated constructs (gRNA control, mitoCas9 and U6-sgRNA to eGFP; gRNA Cox1, Cox3, mitoCas9, and U6-sgRNA to Cox1 and Cox3), determined by real-time quantitative PCR using primers listed in at the indicated time points (2 days and 5 days after transfection). GAPDH was used as an internal loading control ( n = 3 per group). (b) Quantification of messenger RNAs for ND1, Cox1, and Cox2 genes in HEK-293T cells 5 days following transient transfection with lentiCRISPR-sgRNA-Cox1 + Cox3 or lentiCRISPR-sgRNA-eGFP#2 control determined by real-time PCR and normalized to GAPDH ( n = 3 per group). (c) Representative images of mitotracker Red staining for functional mitochondria in HEK-293T cells transfected with the indicated constructs (upper panel). Quantification of relative mitotracker Red staining intensities in two groups was shown in the bottom panel ( n = 50 mitochondria from three independent cultures per group). (d) Cell counts demonstrating proliferation rate of the HEK-293T cells following cleavage of specific mtDNA loci ( n = 6 individual measurements per group). Days indicate the time intervals proceeded after cell seeding following 5 days of transient transfectin. Quantified data are expressed as mean ± s.e.m., ∗ P < 0.05, ∗∗ P < 0.01, and ∗∗∗ P < 0.001, unpaired two-tailed Student's t -test.
Article Snippet: LentiCRISPR and
Techniques: Transfection, Construct, Real-time Polymerase Chain Reaction, Staining, Functional Assay, Two Tailed Test