|
Miltenyi Biotec
cd34 microbead kit  Cd34 Microbead Kit, supplied by Miltenyi Biotec, used in various techniques. Bioz Stars score: 99/100, based on 1 PubMed citations. ZERO BIAS - scores, article reviews, protocol conditions and more https://www.bioz.com/result/cd34 microbead kit/product/Miltenyi Biotec Average 99 stars, based on 1 article reviews
cd34 microbead kit - by Bioz Stars,
2026-02
99/100 stars
|
Buy from Supplier |
|
New England Biolabs
q5 high fidelity polymerase 2x ready mix neb cat Q5 High Fidelity Polymerase 2x Ready Mix Neb Cat, supplied by New England Biolabs, used in various techniques. Bioz Stars score: 96/100, based on 1 PubMed citations. ZERO BIAS - scores, article reviews, protocol conditions and more https://www.bioz.com/result/q5 high fidelity polymerase 2x ready mix neb cat/product/New England Biolabs Average 96 stars, based on 1 article reviews
q5 high fidelity polymerase 2x ready mix neb cat - by Bioz Stars,
2026-02
96/100 stars
|
Buy from Supplier |
|
Thermo Fisher
power sybr™ green pcr master mix Power Sybr™ Green Pcr Master Mix, supplied by Thermo Fisher, used in various techniques. Bioz Stars score: 90/100, based on 1 PubMed citations. ZERO BIAS - scores, article reviews, protocol conditions and more https://www.bioz.com/result/power sybr™ green pcr master mix/product/Thermo Fisher Average 90 stars, based on 1 article reviews
power sybr™ green pcr master mix - by Bioz Stars,
2026-02
90/100 stars
|
Buy from Supplier |
|
Cell Signaling Technology Inc
rabbit phospho axl  Rabbit Phospho Axl, supplied by Cell Signaling Technology Inc, used in various techniques. Bioz Stars score: 95/100, based on 1 PubMed citations. ZERO BIAS - scores, article reviews, protocol conditions and more https://www.bioz.com/result/rabbit phospho axl/product/Cell Signaling Technology Inc Average 95 stars, based on 1 article reviews
rabbit phospho axl - by Bioz Stars,
2026-02
95/100 stars
|
Buy from Supplier |
|
Miltenyi Biotec
human cd31 microbead isolation kit miltenyi biotec ![Figure 3. Engraftment of hPSC-Derived Angioblasts and LSEC-LCs in Neonatal NSG Mice (A) Engraftment potential (RFP+ % non-parenchymal cells [NPCs]) of venous and arterial angioblasts (day 8, CD34+), LSEC-LCs (day 14–16, <t>CD31+),</t> and human umbilical vein endothelial cells (HUVECs) (CD31+ % NPCs) within the liver NPC population following neonatal engraftment. (B) Frequency of mice (from A) with >1% human RFP+. Neonatal Transplant (Tx), day 8 CD34+ Artery (Art.) n = 1/8; day 8 CD34+ Vein n = 9/19; day 14–16 CD31+](https://pub-med-unpaywalled-images-cdn.bioz.com/pub_med_ids_ending_with_0183/pm32640183/pm32640183__page8_image1.jpg) Human Cd31 Microbead Isolation Kit Miltenyi Biotec, supplied by Miltenyi Biotec, used in various techniques. Bioz Stars score: 97/100, based on 1 PubMed citations. ZERO BIAS - scores, article reviews, protocol conditions and more https://www.bioz.com/result/human cd31 microbead isolation kit miltenyi biotec/product/Miltenyi Biotec Average 97 stars, based on 1 article reviews
human cd31 microbead isolation kit miltenyi biotec - by Bioz Stars,
2026-02
97/100 stars
|
Buy from Supplier |
|
Thermo Fisher
target-specific pcr primers (mir-667, mir-702, mir-3562, mir-3568 and mir-3584)  Target Specific Pcr Primers (Mir 667, Mir 702, Mir 3562, Mir 3568 And Mir 3584), supplied by Thermo Fisher, used in various techniques. Bioz Stars score: 90/100, based on 1 PubMed citations. ZERO BIAS - scores, article reviews, protocol conditions and more https://www.bioz.com/result/target-specific pcr primers (mir-667, mir-702, mir-3562, mir-3568 and mir-3584)/product/Thermo Fisher Average 90 stars, based on 1 article reviews
target-specific pcr primers (mir-667, mir-702, mir-3562, mir-3568 and mir-3584) - by Bioz Stars,
2026-02
90/100 stars
|
Buy from Supplier |
|
Miltenyi Biotec
cd49b  Cd49b, supplied by Miltenyi Biotec, used in various techniques. Bioz Stars score: 93/100, based on 1 PubMed citations. ZERO BIAS - scores, article reviews, protocol conditions and more https://www.bioz.com/result/cd49b/product/Miltenyi Biotec Average 93 stars, based on 1 article reviews
cd49b - by Bioz Stars,
2026-02
93/100 stars
|
Buy from Supplier |
|
Selleck Chemicals
p38α  P38α, supplied by Selleck Chemicals, used in various techniques. Bioz Stars score: 94/100, based on 1 PubMed citations. ZERO BIAS - scores, article reviews, protocol conditions and more https://www.bioz.com/result/p38α/product/Selleck Chemicals Average 94 stars, based on 1 article reviews
p38α - by Bioz Stars,
2026-02
94/100 stars
|
Buy from Supplier |
|
Thermo Fisher
taqman universal pcr master mix Taqman Universal Pcr Master Mix, supplied by Thermo Fisher, used in various techniques. Bioz Stars score: 90/100, based on 1 PubMed citations. ZERO BIAS - scores, article reviews, protocol conditions and more https://www.bioz.com/result/taqman universal pcr master mix/product/Thermo Fisher Average 90 stars, based on 1 article reviews
taqman universal pcr master mix - by Bioz Stars,
2026-02
90/100 stars
|
Buy from Supplier |
|
Bio-Rad
cfx384 real time pcr system 702 Cfx384 Real Time Pcr System 702, supplied by Bio-Rad, used in various techniques. Bioz Stars score: 99/100, based on 1 PubMed citations. ZERO BIAS - scores, article reviews, protocol conditions and more https://www.bioz.com/result/cfx384 real time pcr system 702/product/Bio-Rad Average 99 stars, based on 1 article reviews
cfx384 real time pcr system 702 - by Bioz Stars,
2026-02
99/100 stars
|
Buy from Supplier |
|
Bio-Rad
real-time pcr system Real Time Pcr System, supplied by Bio-Rad, used in various techniques. Bioz Stars score: 90/100, based on 1 PubMed citations. ZERO BIAS - scores, article reviews, protocol conditions and more https://www.bioz.com/result/real-time pcr system/product/Bio-Rad Average 90 stars, based on 1 article reviews
real-time pcr system - by Bioz Stars,
2026-02
90/100 stars
|
Buy from Supplier |
|
Microcon Inc
pcr amicon®microcon-pcr centrifugal filter devices Pcr Amicon®Microcon Pcr Centrifugal Filter Devices, supplied by Microcon Inc, used in various techniques. Bioz Stars score: 90/100, based on 1 PubMed citations. ZERO BIAS - scores, article reviews, protocol conditions and more https://www.bioz.com/result/pcr amicon®microcon-pcr centrifugal filter devices/product/Microcon Inc Average 90 stars, based on 1 article reviews
pcr amicon®microcon-pcr centrifugal filter devices - by Bioz Stars,
2026-02
90/100 stars
|
Buy from Supplier |
Image Search Results
Journal: bioRxiv
Article Title: N-MYC regulates Cell Survival via eIF4G1 in inv(16) Acute Myeloid Leukemia
doi: 10.1101/2023.03.03.531018
Figure Lengend Snippet: ( A ). Scatter plot of differentially expressed genes in RNA-seq analysis between DMSO- and AI-10-49-treated ME-1 cells (>2-fold change; FDR < 0.01). Genes significantly changed are colored in red and blue for upregulated and downregulated, respectively. c-MYC and N-MYC are highlighted. ( B ). N-MYC transcript levels in DMSO / AI-10-49 treated (6 hrs) ME-1 cells by Real Time RT-PCR. Histogram representative of triplicate experiments. ( C ). N-MYC protein levels in AI-10-49 treated (1 μM) ME-1 cells by western blot. ( D ). MYCN transcript levels in human cord blood CD34+ cells (CB CD34+) and primary human inv(16) AML CD34+ cells (inv(16) CD34+). Each symbol represents the average of a triplicate experiment from one sample, and the average value of the group is shown in red. ( E ). Normalized expression of MYCN transcript levels in Haferlach dataset extracted from Leukemia Gene Atlas (expression array) database. Error bars represent the SD. Significance was calculated using an unpaired t-test. *p < 0.05 or **p < 0.005 or ***p < 0.0005.
Article Snippet: For ChIP qPCR in human primary AML sample with inv(16), CD34+ cells were enriched using
Techniques: RNA Sequencing, Quantitative RT-PCR, Western Blot, Expressing
Journal: bioRxiv
Article Title: N-MYC regulates Cell Survival via eIF4G1 in inv(16) Acute Myeloid Leukemia
doi: 10.1101/2023.03.03.531018
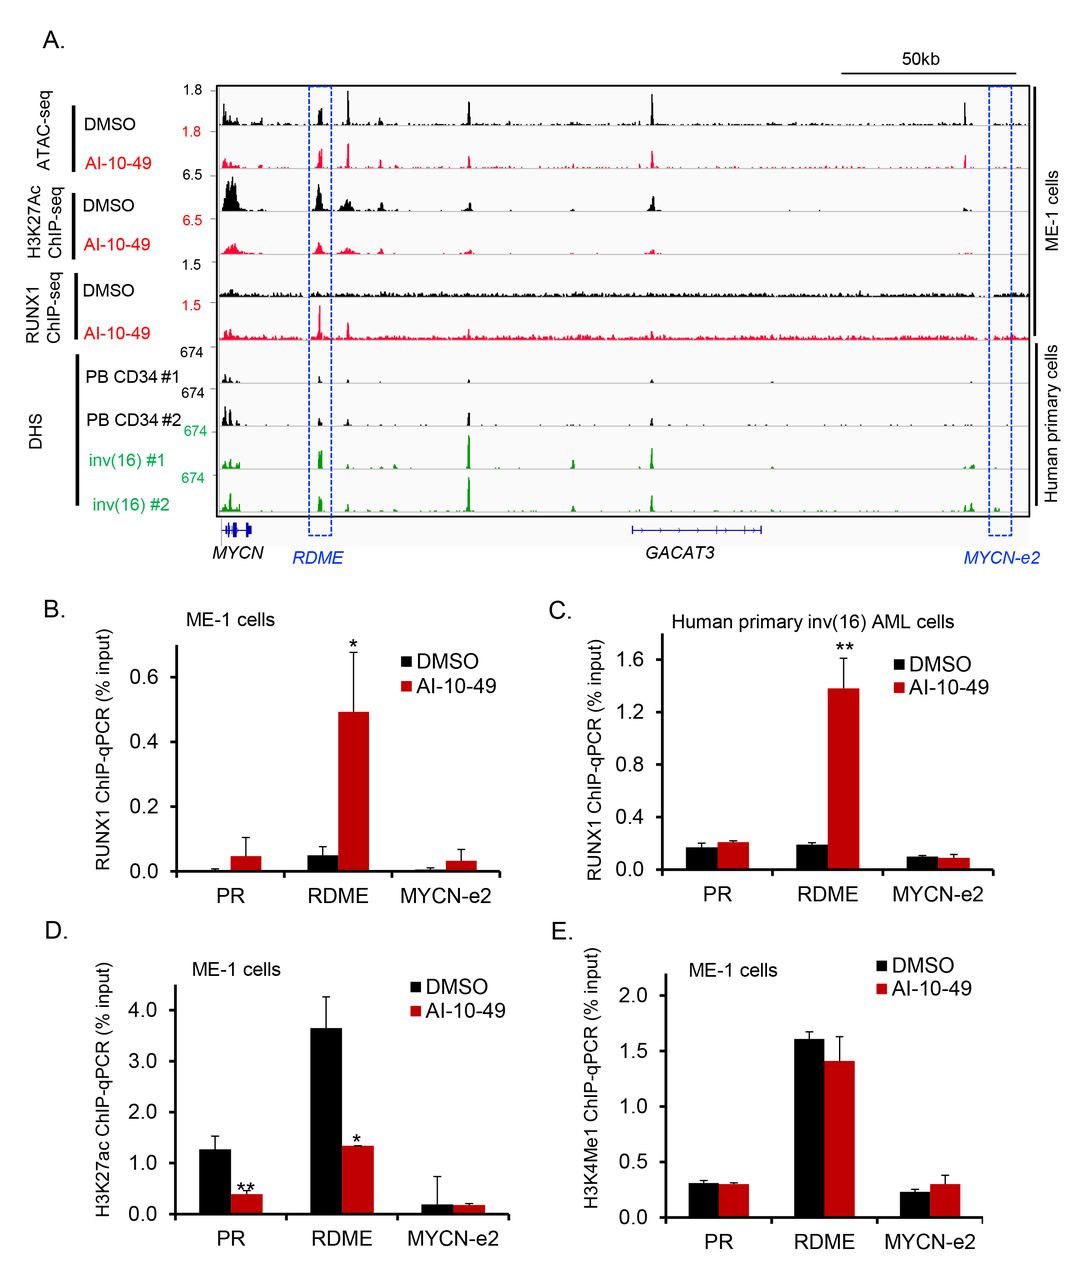
Figure Lengend Snippet: ( A ). Representative examples of Integrative Genome Viewer (IGV) tracks of ATAC-seq, ChIP-seq, and DNase I-seq analysis in ME-1 cells, healthy peripheral blood CD34+ cells, and purified primary human AML cells. PB CD34: Mobilized CD34+ cells in peripheral blood from healthy individuals; inv(16): CD34+ cells from human primary AML samples with inv(16). ( B-C ). ChIP-qPCR analysis for RUNX1 in DMSO- or AI-10-49-treated cells ME-1 cells (B) and primary human inv(16) AML cells (C). ( D-E ). ChIP-qPCR analysis for H3K27ac (D) and H3K4me1 (E) in DMSO- or AI-10-49 treated ME-1 cells. Histogram representative of triplicate experiments. Error bars represent the SD. Significance was calculated using an unpaired t-test. *p < 0.05 or **p < 0.005.
Article Snippet: For ChIP qPCR in human primary AML sample with inv(16), CD34+ cells were enriched using
Techniques: ChIP-sequencing, Purification, ChIP-qPCR
![( A ). Filtering scheme for identifying N-MYC targets in inv(16) AML. N-MYC -bound regions (p < 0.05) were intersected with the H3K27ac histone mark (p < 0.05). Candidate MYCN targets identified were used for gene ontology enrichment analysis. ( B ). Genome-wide distribution of N-MYC and H3K27ac peaks in CUT&TAG-seq. ( C ). Dot plot of gene ontology enrichment analysis of N-MYC targets identified in inv(16) AML. The diameter indicates the number of genes overlapping the gene ontology term, and the color indicates the enrichment P-value. ( D ). Venn diagram showing the overlap between significant differentially expressed genes in AI-10-49 treated ME-1 cells (±2 fold change; adj. p < 0.05) identified in the RNA-seq, transcripts significantly deregulated in human inv(16) AML CD34+ cells compared to normal bone marrow CD34+ cells in Haferlach dataset extracted from Leukemia Gene Atlas (expression array) database and peaks called in N-MYC CUT&Tag. ( E ). Representative examples of Integrative Genome Viewer (IGV) tracks of CUT&Tag-seq, RNA-seq, and DNase I-seq analysis in ME-1 cells, healthy peripheral blood CD34+ cells, and purified human primary AML cells. ( F ). ChIP-qPCR analysis for N-MYC binding region in EIF4G1 promoter and a non-binding region in EIF4G 1 locus in ME-1 cells. Histogram representative of triplicate experiments. ( G ). Normalized expression of EIF4G1 in Haferlach dataset extracted from Leukemia Gene Atlas (expression array) databases. ( H ). eIF4G1 transcript levels in human cord blood CD34+ cells and human primary inv(16) AML CD34+ cells. Each symbol represents the average of a triplicate experiment from one sample, and the average value of the group is shown in red. ( I ) ME-1 cells were transfected with Cas9 and control gRNAs/ MYCN gRNAs [Synthego Gene Knockout kit V2] by RNP approach and analyzed N-MYC and eIF4G1 protein levels by western blot. Error bars represent the SD. Significance was calculated using an unpaired t-test. **p < 0.005 or ***p < 0.0005.](https://bio-rxiv-images-cdn.bioz.com/dois_ending_with_18/10__1101_slash_2023__03__03__531018/10__1101_slash_2023__03__03__531018___F6.large.jpg)
Journal: bioRxiv
Article Title: N-MYC regulates Cell Survival via eIF4G1 in inv(16) Acute Myeloid Leukemia
doi: 10.1101/2023.03.03.531018
Figure Lengend Snippet: ( A ). Filtering scheme for identifying N-MYC targets in inv(16) AML. N-MYC -bound regions (p < 0.05) were intersected with the H3K27ac histone mark (p < 0.05). Candidate MYCN targets identified were used for gene ontology enrichment analysis. ( B ). Genome-wide distribution of N-MYC and H3K27ac peaks in CUT&TAG-seq. ( C ). Dot plot of gene ontology enrichment analysis of N-MYC targets identified in inv(16) AML. The diameter indicates the number of genes overlapping the gene ontology term, and the color indicates the enrichment P-value. ( D ). Venn diagram showing the overlap between significant differentially expressed genes in AI-10-49 treated ME-1 cells (±2 fold change; adj. p < 0.05) identified in the RNA-seq, transcripts significantly deregulated in human inv(16) AML CD34+ cells compared to normal bone marrow CD34+ cells in Haferlach dataset extracted from Leukemia Gene Atlas (expression array) database and peaks called in N-MYC CUT&Tag. ( E ). Representative examples of Integrative Genome Viewer (IGV) tracks of CUT&Tag-seq, RNA-seq, and DNase I-seq analysis in ME-1 cells, healthy peripheral blood CD34+ cells, and purified human primary AML cells. ( F ). ChIP-qPCR analysis for N-MYC binding region in EIF4G1 promoter and a non-binding region in EIF4G 1 locus in ME-1 cells. Histogram representative of triplicate experiments. ( G ). Normalized expression of EIF4G1 in Haferlach dataset extracted from Leukemia Gene Atlas (expression array) databases. ( H ). eIF4G1 transcript levels in human cord blood CD34+ cells and human primary inv(16) AML CD34+ cells. Each symbol represents the average of a triplicate experiment from one sample, and the average value of the group is shown in red. ( I ) ME-1 cells were transfected with Cas9 and control gRNAs/ MYCN gRNAs [Synthego Gene Knockout kit V2] by RNP approach and analyzed N-MYC and eIF4G1 protein levels by western blot. Error bars represent the SD. Significance was calculated using an unpaired t-test. **p < 0.005 or ***p < 0.0005.
Article Snippet: For ChIP qPCR in human primary AML sample with inv(16), CD34+ cells were enriched using
Techniques: Genome Wide, RNA Sequencing, Expressing, Purification, ChIP-qPCR, Binding Assay, Transfection, Control, Gene Knockout, Western Blot
Journal: Heliyon
Article Title: Cabozantinib prevents the progression of metabolic dysfunction-associated steatohepatitis by inhibiting the activation of hepatic stellate cell and macrophage and attenuating angiogenic activity
doi: 10.1016/j.heliyon.2024.e38647
Figure Lengend Snippet: Effect of cabozantinib on GAS6/AXL signaling in LX-2 cells. (A) Serum Gas6 level in the experimental rats. (B) Hepatic mRNA expression of Axl in the experimental rats. (C) Western blotting for the effect of cabozantinib (CBZ) (0−50 nM) on the phosphorylation of AXL and AKT in rGAS6 (500 ng/mL)-stimulated LX-2 cells. Whole images of blotting were shown in in Effect of CBZ (0−50 nM) on rGAS6 (500 ng/mL)-induced LX-2 proliferation. (E) Inducible effect of rGAS6 (500 ng/mL) on the mRNA expression of profibrogenic markers (ACTA2, COL1A1, TIMP1 and CTGF) in LX-2 cells. (F) Effect of CBZ (0−50 nM) on the mRNA expression of profibrogenic markers in rGAS6 (500 ng/mL)-stimulated LX-2 cells. Gapdh/GAPDH was used as an internal control for qRT-PCR (B, E and F). Actin was used as an internal control for western blotting (C). Quantitative values are indicated as fold changes to the values of CS group (B), the value of each group at 0 h (D), the value at 0 h (E) and the value of rGAS6 (−)/CBZ (−) group (F). Data are the mean ± SD (n = 8; A and B, n = 6; D−F). a, aa : P < 0.05, 0.01 vs CS group (A and B), rGAS6 (−)/CBZ (−) group at 72 h (D), 0 h group (E), rGAS6 (−)/CBZ (−) group (F), b, bb : P < 0.05, 0.01 vs CD + Veh group (A and B), rGAS6 (+)/CBZ (−) group at 72 h (D), rGAS6 (+)/CBZ (−) group (F) significant difference between groups by Student's t-test. CS, CSANFD-fed and vehicle-treated group; CD + Veh, CDAHFD-fed and vehicle-treated group; CD + CBZ-L, CDAHFD-fed and cabozantinib (1 mg/kg)-treated group; CD + CBZ-H, CDAHFD-fed and cabozantinib (2 mg/kg)-treated group.
Article Snippet: The primary antibodies include
Techniques: Expressing, Western Blot, Phospho-proteomics, Control, Quantitative RT-PCR
Journal: Cell stem cell
Article Title: Generation of Functional Liver Sinusoidal Endothelial Cells from Human Pluripotent Stem-Cell-Derived Venous Angioblasts.
doi: 10.1016/j.stem.2020.06.007
Figure Lengend Snippet: Figure 3. Engraftment of hPSC-Derived Angioblasts and LSEC-LCs in Neonatal NSG Mice (A) Engraftment potential (RFP+ % non-parenchymal cells [NPCs]) of venous and arterial angioblasts (day 8, CD34+), LSEC-LCs (day 14–16, CD31+), and human umbilical vein endothelial cells (HUVECs) (CD31+ % NPCs) within the liver NPC population following neonatal engraftment. (B) Frequency of mice (from A) with >1% human RFP+. Neonatal Transplant (Tx), day 8 CD34+ Artery (Art.) n = 1/8; day 8 CD34+ Vein n = 9/19; day 14–16 CD31+
Article Snippet: REAGENT or RESOURCE SOURCE IDENTIFIER Critical Commercial Assays VisuLize Factor VIII Antigen Kit (Lot:AG8-0050) Affinity Biologicals Cat# FVIII-AG Formaldehyde-treated serum albumin, FITC labeled D’Liver Cat# FSA-F Acetylated LDL-AF488 Invitrogen Cat# L23380 E.coli BioParticles-AF594 Invitrogen Cat# E23370 Human CD34 MicroBead Isolation kit Miltenyi Biotec Cat# 130-046-702
Techniques: Derivative Assay

Journal: Cell stem cell
Article Title: Generation of Functional Liver Sinusoidal Endothelial Cells from Human Pluripotent Stem-Cell-Derived Venous Angioblasts.
doi: 10.1016/j.stem.2020.06.007
Figure Lengend Snippet: Figure 4. Engraftment of hPSC-Derived Angioblasts in Adult NSG Mice (A) Engraftment of venous and arterial angioblasts (day 8, CD34+) within liver NPCs at the indicated days following transplantation into adult NSG mice. (B) Frequency of mice (from A) with >1% human RFP+. Adult Tx: day 8 CD34+ Art. n = 12/12; day 8 CD34+ Vein n = 18/18. (C) Flow cytometric analysis of NPC populations generated from day 8 venous angioblasts 55 days post-transplantation. (D) Quantification of RFP+ NPC subpopulations in grafts from arterial or venous angioblasts (mean ± SEM, n = 8–15 mice per transplant group). (E) qRT-PCR analysis of LSEC markers in FACS-isolated CD31, CD32, and LYVE1 NPC subpopulations derived from venous angioblasts 55–83 days post- transplant. Values are normalized to TBP (mean ± SEM, one-way ANOVA; *p < 0.05, **p < 0.01, ***p < 0.001 versus RFP+ CD31+CD32LYVE1 cells and as indicated; red line, primary LSECs; NR indicates not recoverable RFP+ CD31 cells). (F) Quantification of LSEC engraftment (% RFP+ CD31+CD32+LYVE1+ of NPCs) from transplanted angioblasts at the indicated times.
Article Snippet: REAGENT or RESOURCE SOURCE IDENTIFIER Critical Commercial Assays VisuLize Factor VIII Antigen Kit (Lot:AG8-0050) Affinity Biologicals Cat# FVIII-AG Formaldehyde-treated serum albumin, FITC labeled D’Liver Cat# FSA-F Acetylated LDL-AF488 Invitrogen Cat# L23380 E.coli BioParticles-AF594 Invitrogen Cat# E23370 Human CD34 MicroBead Isolation kit Miltenyi Biotec Cat# 130-046-702
Techniques: Derivative Assay, Transplantation Assay, Generated, Quantitative RT-PCR, Isolation

Journal: Cell stem cell
Article Title: Generation of Functional Liver Sinusoidal Endothelial Cells from Human Pluripotent Stem-Cell-Derived Venous Angioblasts.
doi: 10.1016/j.stem.2020.06.007
Figure Lengend Snippet: Figure 5. Histological Characterization of Engrafting Endothelial Cells (A–J) Histological analysis of livers from mice engrafted with venous angioblasts (A–E; neonatal 88 days post-transplant; F–J; adult 55 days post-transplant). Sections were analyzed with human-specific endothelial/LSEC markers (CD31, LYVE1, CD32B, and STAB2) and the human-specific nuclear antigen Ku80. LYVE1 and Ku80 expression (A, D, F, and I), CD31 and Ku80 expression (B and G), CD32B and Ku80 expression (C and H), and STAB2 and Ku80 expression (E and J) are depicted. ‘‘*’’ indicates location of enlarged inset panels; scale bars represent 60 mm unless otherwise indicated. (K–P) Immunofluorescence analyses of liver samples (vein-angioblast-derived grafts 33–88 days post-transplant) from neonatal (K, M, and N) and adult (L, O, and P) transplant models stained for LSEC and endothelial markers, mouse macrophage marker F4/80, and counterstained with DAPI. (K) LYVE1, CD32B and MRC1 expression. (L) LYVE1 and STAB2 expression. (M) Ku80 and human FVIII expression. (N) GATA4, CD32B, and CD31 expression. (O) LYVE1 and mouse F4/80 expression. (P) Ku80 and CD34 expression neighbouring a bile duct. ‘‘*’’ indicates location of enlarged single-channel inset panels as indicated; scale bar represents 50 mm. The central vein (CV), portal vein (PV) and bile duct (BD) are indicated.
Article Snippet: REAGENT or RESOURCE SOURCE IDENTIFIER Critical Commercial Assays VisuLize Factor VIII Antigen Kit (Lot:AG8-0050) Affinity Biologicals Cat# FVIII-AG Formaldehyde-treated serum albumin, FITC labeled D’Liver Cat# FSA-F Acetylated LDL-AF488 Invitrogen Cat# L23380 E.coli BioParticles-AF594 Invitrogen Cat# E23370 Human CD34 MicroBead Isolation kit Miltenyi Biotec Cat# 130-046-702
Techniques: Expressing, Derivative Assay, Staining, Marker

Journal: Cell stem cell
Article Title: Generation of Functional Liver Sinusoidal Endothelial Cells from Human Pluripotent Stem-Cell-Derived Venous Angioblasts.
doi: 10.1016/j.stem.2020.06.007
Figure Lengend Snippet: Figure 7. Analyses of Fenestrations and Scavenging Potential of hPSC-Derived LSECs (A and B) Scanning electron microscopic images of primary human in situ LSECs, hepatic venous and arterial endothelium, and isolated hPSC-derived pop- ulations from venous angioblast engrafted livers (38–77 days). (A) Primary liver tissue with LSEC in sinusoid under low magnification (left) and higher magnification (middle left), and high magnification of hepatic vein (middle right), and hepatic artery (right). (B) Indicated FACS isolated hPSC-derived populations under low (top) and high (bottom) magnifications. Higher-magnification image (yellow box area in low magnification) depicts fenestrations (white arrows) arranged in sieve plates (yellow arrows) in CD31+CD32+LYVE1+ cells and primary LSECs. Scale bars as indicated below images. (C) Frequency of fenestrated cells (>10 fenestrations in a sieve plate), endothelial cells (smooth-edged cells with angiogenic lateral sprouts), and non-endothelial cells (fibroblast-like cells and rounded cells) was performed manually on the indicated numbers of cells (four or more independent experiments). In vitro-derived venous LSEC-LCs and multi-donor-derived HUVECs were assessed alongside the graft-derived populations. (D) Fenestration size (longest diameter) in primary human LSECs in situ (n = 5 cells, white) and venous-angioblast-derived LSECs (n = 8 cells, black). (E–J) Flow cytometric analysis (E, G, and I) and quantification (F, H, and J) of ligand binding in indicated venous-angioblast-derived populations 72–99 days post- transplantation. (E and F) E. coli bioparticle binding in the presence of human immunoglobulin G (IgG) (60 min, 37C). (G and H) AcLDL-AF488 binding (10 min, 37C). (I and J) FITC-conjugated formaldehyde fixed serum albumin (FSA) binding (10 min, 37C) (mean ± SEM, one-way ANOVA; **p < 0.01, ***p < 0.001, as indicated).
Article Snippet: REAGENT or RESOURCE SOURCE IDENTIFIER Critical Commercial Assays VisuLize Factor VIII Antigen Kit (Lot:AG8-0050) Affinity Biologicals Cat# FVIII-AG Formaldehyde-treated serum albumin, FITC labeled D’Liver Cat# FSA-F Acetylated LDL-AF488 Invitrogen Cat# L23380 E.coli BioParticles-AF594 Invitrogen Cat# E23370 Human CD34 MicroBead Isolation kit Miltenyi Biotec Cat# 130-046-702
Techniques: Derivative Assay, In Situ, Isolation, In Vitro, Ligand Binding Assay, Transplantation Assay, Binding Assay
Journal: PLoS ONE
Article Title: Differential miRNA Expression in Cells and Matrix Vesicles in Vascular Smooth Muscle Cells from Rats with Kidney Disease
doi: 10.1371/journal.pone.0131589
Figure Lengend Snippet: To validate the miRNA identified by the arrays that regulate multiple genes, we performed Real time PCR on VSMc and MV to determine the expression of miR-667, miR-702, miR-3562, mir-3568 and miR-3584 and normalized by U6. Each sample (n = 3 with MV and VSMC isolated from 3 CKD rats, same samples as arrays) was assayed in triplicate. The results demonstrated increased expression in MV compared to VSMC for each of these miRNAs, confirming the array results. Data were expressed as mean ± SEM. * p<0.05, MV vs. VSMC.
Article Snippet: Target-specific
Techniques: Real-time Polymerase Chain Reaction, Expressing, Isolation
Journal: eLife
Article Title: Plasmacytoid dendritic cells control dengue and Chikungunya virus infections via IRF7-regulated interferon responses
doi: 10.7554/eLife.34273
Figure Lengend Snippet: ( A ) Quantification of DENV genome levels in WT, Irf3/7 DKO and pDC:Irf7 + mice using a primer set more specific for replicative DENV by targeting the 3’UTR of DENV genome. WT, Irf3/7 DKO and pDC:Irf7 + mice were infected as in . Levels of DENV RNA were assessed by qRT-PCR using a primer set targeting the DENV 3’ UTR in spleens collected at the indicated time p.i. Results are expressed as log 10 DENV genome equivalent (GE) normalized to a panel of housekeeping genes ( hprt1 , β-actin , and 18S rRNA). ( B ) Ly6C is upregulated on pDCs following exposure to DENV infected cells. pDCs were isolated from BM of WT mice and cocultured with DENV infected Huh7.5.1 cells infected (DENV cells) or treated with DENV infectious supernatant (DENV SN) or TLR7 agonists (R848) for 22 hr. pDCs were identified as Siglec-H + cells and Ly6C MFI was compared on pDCs under the indicated conditions. ( C ) Gating strategy for pDCs from splenocyte populations. Lineage markers (CD2, CD3, CD19, CD49b, TER119) were used to gate out lymphocytes/NK cells/erythrocytes and Siglec-H + /mPDCA1 + /B220 med cells were positively identified as pDCs. ( D–E ) The upregulation of Ly6C and down-regulation of Siglec-H expression on pDCs is temporally associated with the type I IFN-induced ISG response. pDCs were gated as in ( C ) from splenocytes isolated from mice infected for 18-to-72h as in , and Ly6C and Siglec-H MFI were compared on pDCs to uninfected controls of each mouse genotype; geometric mean, n = 3–6 mice per condition.
Article Snippet: For flow cytometry, FACs sorting, and magnetic cell isolation, biotin, BV421, Pacific Blue, FITC, PE, PE-Cy7, APC, AlexaFluor-647, AlexaFluor-700, APC-eFluor780 or PerCP-Cy5.5 conjugates of the following anti-mouse antibodies were used (clone in parentheses): Siglec-H (440 c), B220 (RA3-6B2), CD11c (N418), CD11b (M1/70), CD8a (53–6.7), CD2 (RM2-5), CD19 (1D3), CD4 (GK1.5), CD3 (17A2, 500A2), NK1.1 (PK136), CD69 (H1.2F3), Ly6C (HK1.4), Ly6G (1A8), PDCA-1 (JF05-1C2.4.1), CD25 (3C7),
Techniques: Infection, Quantitative RT-PCR, Isolation, Expressing

Journal: eLife
Article Title: Plasmacytoid dendritic cells control dengue and Chikungunya virus infections via IRF7-regulated interferon responses
doi: 10.7554/eLife.34273
Figure Lengend Snippet: ( A ) Gating strategy for cell populations from splenocytes/PBMCs. Cells were identified as follows: NK cells: CD3 - /NK1.1 + , NKT cells: CD3 + /NK1.1 + , γδ-T cells: CD3 + /TCRβ - /TCRγδ + , αβ-T cells: CD3 + /TCRβ + /TCRγδ - , Neutrophils: SSC-A med /Ly6G + . ( B–C ) Greater activation and IFNγ secretion in splenic compared to blood NK cells in response to DENV in pDC:Irf7 + mice. Spleen and blood samples were collected from DENV-infected pDC:Irf7 + mice at 48 h p.i.. Cell populations were identified as in ( A ). ( B ) Representative histograms of CD69 activation marker and IFNγ fluorescence on various cell populations in n = 2 infected and n = 1 uninfected representative mice. ( C ) CD69 activation marker median fluorescence intensity on various cell populations; geometric mean ±SD, n = 4–6 infected, n = 1–2 uninfected mice per population. ( D ) Neutrophil influx into the spleen correlates with the timing/magnitude of type II IFN responses. Left panel, neutrophils were identified as Ly6C med /Ly6G + population in splenocytes isolated from mice infected as in ( A–C ). Right panel, the percentages of neutrophils relative to total splenocytes were expressed as fold change relative to uninfected controls for each mouse genotype; n = 3–7 mice for each condition. ( E ) Early monocyte activation is enhanced by IRF7 activity in pDCs. Left panel, lineage markers (CD2, CD3, CD19, CD49b, TER119) were used to gate out lymphocytes/NK cells/erythrocytes and Ly6C ++ cells were identified as inflammatory monocytes. Note the lack of Siglech expression on this population. Right panel, results are shown as the fold change of the median fluorescence intensity (MFI) of the activation marker MHCII on inflammatory monocytes, identified as in the left panel and normalized to uninfected mice from each genotype; n = 3–7 mice per condition.
Article Snippet: For flow cytometry, FACs sorting, and magnetic cell isolation, biotin, BV421, Pacific Blue, FITC, PE, PE-Cy7, APC, AlexaFluor-647, AlexaFluor-700, APC-eFluor780 or PerCP-Cy5.5 conjugates of the following anti-mouse antibodies were used (clone in parentheses): Siglec-H (440 c), B220 (RA3-6B2), CD11c (N418), CD11b (M1/70), CD8a (53–6.7), CD2 (RM2-5), CD19 (1D3), CD4 (GK1.5), CD3 (17A2, 500A2), NK1.1 (PK136), CD69 (H1.2F3), Ly6C (HK1.4), Ly6G (1A8), PDCA-1 (JF05-1C2.4.1), CD25 (3C7),
Techniques: Activation Assay, Infection, Marker, Fluorescence, Isolation, Activity Assay, Expressing

Journal: eLife
Article Title: Plasmacytoid dendritic cells control dengue and Chikungunya virus infections via IRF7-regulated interferon responses
doi: 10.7554/eLife.34273
Figure Lengend Snippet: ( A ) NK cell depletion assessed in the spleen and blood samples of anti-NK1.1-treated pDC:Irf7 + mice. pDC:Irf7 + mice were injected i.p. with anti-NK1.1 blocking antibody or IgG1 control antibody and infected as in . Left panels, gating strategy for NK cells (CD3 - /CD49b + ) in splenocytes of anti-NK1.1 and control IgG1-treated pDC:Irf7 + mice, collected at 48 hr. Note the use of CD49b as an alternate NK cell marker to avoid epitope masking. Right panel, NK cells as a percentage of total PBMCs were identified as in left panels, mean ± SD, n = 4 mice per condition. ( B ) Neutrophil influx into the spleen depends on the presence of NK cells. Splenocytes were isolated from pDC:Irf7 + mice 48 h p.i. with DENV and neutrophils were identified as Ly6C med /Ly6G + cells, as in ; mean ± SD; n = 6–7 mice for each condition. ( C ) Early monocyte activation depends on the presence of NK cells. Splenocytes were isolated from pDC:Irf7 + mice 48 hr post-infection with DENV and monocytes were identified as in and results displayed as in ; geometric mean ± SD, n = 4 mice per condition.
Article Snippet: For flow cytometry, FACs sorting, and magnetic cell isolation, biotin, BV421, Pacific Blue, FITC, PE, PE-Cy7, APC, AlexaFluor-647, AlexaFluor-700, APC-eFluor780 or PerCP-Cy5.5 conjugates of the following anti-mouse antibodies were used (clone in parentheses): Siglec-H (440 c), B220 (RA3-6B2), CD11c (N418), CD11b (M1/70), CD8a (53–6.7), CD2 (RM2-5), CD19 (1D3), CD4 (GK1.5), CD3 (17A2, 500A2), NK1.1 (PK136), CD69 (H1.2F3), Ly6C (HK1.4), Ly6G (1A8), PDCA-1 (JF05-1C2.4.1), CD25 (3C7),
Techniques: Injection, Blocking Assay, Control, Infection, Marker, Isolation, Activation Assay
Journal: International Journal of Molecular Sciences
Article Title: A Ruthenium(II) N -Heterocyclic Carbene (NHC) Complex with Naphthalimide Ligand Triggers Apoptosis in Colorectal Cancer Cells via Activating the ROS-p38 MAPK Pathway
doi: 10.3390/ijms19123964
Figure Lengend Snippet: Naphthalimide-NHC derivatives activate the p38 pathway in human breast- and colon cancer cell lines. ( A ) Immunoblots as well as densitometric quantification ( B ) showing the accumulation of pp38 mitogen activated protein kinase (MAPK) (T180/Y182) protein levels by the three complexes in HCT116 CRC cells upon 24 h treatment with increasing concentrations of the respective compound as indicated. The induction appeared to be more profound in case of the Ru(II) analogue, MC6. Data in ( B ) are presented as mean ± SEM of three independent experiments, one of those is shown in ( A ); ( C ) qRT-PCR analysis of p38-associated signaling molecules, ATF2 and Stat1 in HCT116 cells treated with the compounds at indicated concentrations for 24 h. Lower and upper ends of the bars denote the minimum and maximum values, respectively, with the “+” sign representing the mean of four biological replicates. Error bars ± SD; ( D ) Time-course analyses of pp38 MAPK (T180/Y182) as well as its down-stream effector, pATF2 (T71) in HCT116 cells treated with 12 μM of MC6, determined by immunoblotting; ( E ) Densitometric analyses of pATF2 (T71) and pp38 (T180/Y182) bands obtained from three independent experiments, one of which is depicted in ( D ). Error bars ± SEM; ( F ) Regulation of p38 MAPK signaling was compared among HCT116, MCF-7 and MDA-MB-231 cancer cell lines treated for 24 h with the metal-containing analogues (MC6 and MC7). In case of MDA-MB-231 where the basal levels of pp38 (T180/Y182) are high, treatments did not profoundly impact the molecule’s phosphorylation; ( G ) Densitometric quantifications illustrate no significant change in pp38 (T180/Y182) levels in MDA-MB-231 cells. Error bars ± SEM; n = 3. Statistical comparisons were made between mock (0.1% DMSO) and the respective treatment using two-tailed student’s t -test. p -values less than or equal to 0.05, 0.01, 0.001, and 0.0001 are indicated as *, **, ***, and ****, respectively.
Article Snippet: Pharmacological inhibitors of
Techniques: Western Blot, Quantitative RT-PCR, Analogues, Phospho-proteomics, Two Tailed Test

Journal: International Journal of Molecular Sciences
Article Title: A Ruthenium(II) N -Heterocyclic Carbene (NHC) Complex with Naphthalimide Ligand Triggers Apoptosis in Colorectal Cancer Cells via Activating the ROS-p38 MAPK Pathway
doi: 10.3390/ijms19123964
Figure Lengend Snippet: p38 signaling appears to be crucial for the MC6-mediated cytotoxic- and pro-apoptotic effects. ( A ) siRNA-mediated repression of p38α was found to hamper the growth inhibitory effects of MC6 in HCT116 cells treated with 12 μM of the compound for 24 h, measured by SRB assay. Percentage cell viability was calculated by normalizing the values of MC6-treated cells to those of the corresponding mock (0.1% DMSO) treatments. Error bars ± SD; n = 3; ( B ) Knock-down of p38α attenuates the pro-apoptotic response to MC6 (12 μM, 24 h), assessed by flow cytometric analysis of AV/PI staining. Percentage cell population in each quadrant was normalized to the respective mock (0.1% DMSO) treatment. Error bars ± SD. Multiple comparisons were performed using two-way ANOVA followed by a post-hoc Tukey test; ( C ) Density plots representative of three biological replicates illustrate increased population of AV + /PI − and AV + /PI + with treatment, however, to a lesser extent in case of cells transfected with anti- p38α siRNA; ( D ) Confirmation of knock-down efficiency, as determined by immunoblotting; ( E ) chemical inhibition of p38α abrogates the MC6-mediated apoptosis. HCT116 cells were treated with 12 μM of MC6 in the absence/presence of p38α inhibitors, VX-702 and Ralimetinib at a concentration of 0.5 μM for 24 h. Error bars ± SD, n = 3. Asterisks show significance in the amount of early- and late apoptotic population between cells treated with MC6 and each of the two inhibitors, and MC6 as a single agent, determined by two-tailed student’s t -test; ( F ) Representative density plots of one out of three biological replicates demonstrate reduced number of AV + /PI − and AV + /PI + cells when p38α activity is inhibited; ( G ) Flow cytometric analysis of caspase 3 activation shows significantly less cleaved caspase 3 expression in cells transfected with anti- p38α siRNA as compared to that of the negative control. Error bars ± SD, n = 6. Statistical significance between the two groups was made using two-tailed student’s t -test; ( H ) Chemical inhibition of p38α was found to decrease the levels of active caspase 3 in a similar manner to that of p38α knock-down. Error bars ± SD, n = 6. Statistical comparison was performed between combination treatments and MC6 using two-tailed student’s t -test; ( I ) Representative density plots of one out of six biological replicates; ( J ) Detection of apoptotic cells using TUNEL assay. HCT116 cells were treated with the indicated concentrations of MC6 for 24 h in the absence/presence of VX-702 (0.5 μM). Statistical significance was calculated between mock and the respective treatment as well as MC6 as single agent and in combination with VX-702 using two-tailed student’s t -test; ( K ) Representative fluorescence images of TUNEL reaction. Scale bar: 100 μm. p -values less than or equal to 0.05, 0.01, 0.001, and 0.0001 are denoted as *, **, ***, and ****, respectively.
Article Snippet: Pharmacological inhibitors of
Techniques: Sulforhodamine B Assay, Knockdown, Staining, Transfection, Western Blot, Inhibition, Concentration Assay, Two Tailed Test, Activity Assay, Activation Assay, Expressing, Negative Control, Comparison, TUNEL Assay, Fluorescence

Journal: International Journal of Molecular Sciences
Article Title: A Ruthenium(II) N -Heterocyclic Carbene (NHC) Complex with Naphthalimide Ligand Triggers Apoptosis in Colorectal Cancer Cells via Activating the ROS-p38 MAPK Pathway
doi: 10.3390/ijms19123964
Figure Lengend Snippet: MC6-induced cytotoxicity and pro-apoptotic effects are mediated via the ROS-p38 signaling axis. ( A ) Treatment with GSH and NAC at the indicated concentrations 1 h prior to the addition of MC6 (12 μM) for 24 h blocked the activation of p38 as well as cleavages of caspase 3 and PARP, detected by immunoblotting; ( B ) Densitometric analyses show a significant reduction in the MC6-induced pp38 (T180/Y182) accumulation in the presence of anti-oxidants. Error bars indicate the SEM of three independent experiments, one of those is presented in ( A ); ( C ) Increased cellular survival of HCT116 cells pre-treated with either 5 or 10 mM of GSH 1 h before the addition of MC6 (12 μM) for 24 h, as determined by SRB assay. Data represent mean ± SD of three biological replicates, normalized to mock (0.1% DMSO) and the respective GSH treatment; ( D – F ) HCT116 cells pre-incubated with either 5 or 10 μM of Mito TEMPO (MT) for 2 h were treated with MC6 (12 μM) for 24 h. The mitochondria-targeted ROS scavenger was found to attenuate the MC6-mediated p38 activation as well as PARP cleavage at the highest used concentration (10 μM), as detected by immunoblotting ( D ) and the associated densitometric quantification ( E ), obtained from three independent experiments. Error bars ± SEM. Additionally, it rescued the MC6-mediated cytotoxic effects, as determined by SRB assay ( F ). Percentage cell viability of MC6-treated cells was normalized to mock (0.1% DMSO) and the respective MT treatment. Error bars ± SD; n = 3; ( G ) Flow cytometric analysis of caspase 3 activation illustrates significantly lower levels of the cleaved form of the protein in cells pre-treated for 1 h with either GSH (10 mM) or NAC (10 mM) as compared to that of MC6-treated cells (12 μM, 24 h). Error bars ± SD, n = 3; ( H ) Representative histogram of one out of three biological replicates presented in ( G ) demonstrates a left-ward shift in caspase 3 activity in the presence of ROS scavengers. Statistical significance between the MC6-treated cells in the absence/presence of anti-oxidants was calculated using two-tailed student’s t -test. *, **, ***, and **** on the figures represent p -values that are less than or equal to 0.05, 0.01, 0.001, and 0.0001, respectively.
Article Snippet: Pharmacological inhibitors of
Techniques: Activation Assay, Western Blot, Sulforhodamine B Assay, Incubation, Concentration Assay, Activity Assay, Two Tailed Test