negr1 Search Results


88
Thermo Fisher gene exp negr1 hs02387573 m1
Gene Exp Negr1 Hs02387573 M1, supplied by Thermo Fisher, used in various techniques. Bioz Stars score: 88/100, based on 1 PubMed citations. ZERO BIAS - scores, article reviews, protocol conditions and more
https://www.bioz.com/result/gene exp negr1 hs02387573 m1/product/Thermo Fisher
Average 88 stars, based on 1 article reviews
gene exp negr1 hs02387573 m1 - by Bioz Stars, 2026-03
88/100 stars
  Buy from Supplier

93
R&D Systems goat polyclonal antibodies against negr1
(A) <t>NEGR1+/+</t> cultured hypothalamic neuron immunolabelled for NEGR1, GAD65 and VGAT. Magnified images of the outlined areas show examples of NEGR1 clusters overlapping with GAD65 and VGAT accumulations (arrows). NEGR1-/- neurons were labelled for control. Bars, 10 µm. (B) NEGR1+/+ cultured hypothalamic neurons immunolabelled for a dendritic marker protein MAP2 and axonal marker protein tau. Bar, 20 µm. (C-F) Western blot (WB) analysis of VGAT ( C, D ) and GAD65 ( E, F ) in NEGR1+/+ and NEGR1-/- brain homogenates (H), synaptosomes (S) and soluble protein (sol) fractions. NEGR1 labelling was included in ( C ) to illustrate its enrichment in synaptosomes. Two different exposures of GAD65 labelling in ( E ) are shown to better illustrate a reduction in GAD65 levels in NEGR1-/- synaptosomes and soluble protein fractions. Labelling for GAPDH and Ponceau stain was used to control loading. Labelling for synaptophysin was used to confirm the efficiency of synaptosome isolation. Graphs show mean ± SEM changes in protein enrichment in NEGR1-/- synaptosomes and soluble protein fractions vs enrichment in NEGR1+/+ samples set to 1. n = 5 pairs of NEGR1+/+ and NEGR1-/- mice were analyzed. *p, one sample t test vs +/+. ( G ) NEGR1+/+ and NEGR1-/- cultured hypothalamic neurons immunolabeled for GAD65 and synaptophysin. ( H ) NEGR1-/- cultured hypothalamic neurons transfected with GAD65-GFP and pcDNA3 or NEGR1 immunolabelled for synaptophysin and NEGR1. In G , H , examples of synaptophysin positive (arrowheads) and negative (arrows) GAD65 clusters are shown. Bars, 5 µm. Graphs show cumulative frequency (CF) of neurons with different percentages of synaptophysin negative GAD65 clusters. *p, Mann-Whitney test (n = 20 ( G ) and 30 ( H ) neurons per group). Figure 1 source data. Contains uncropped Western blot source data for Figure 1.
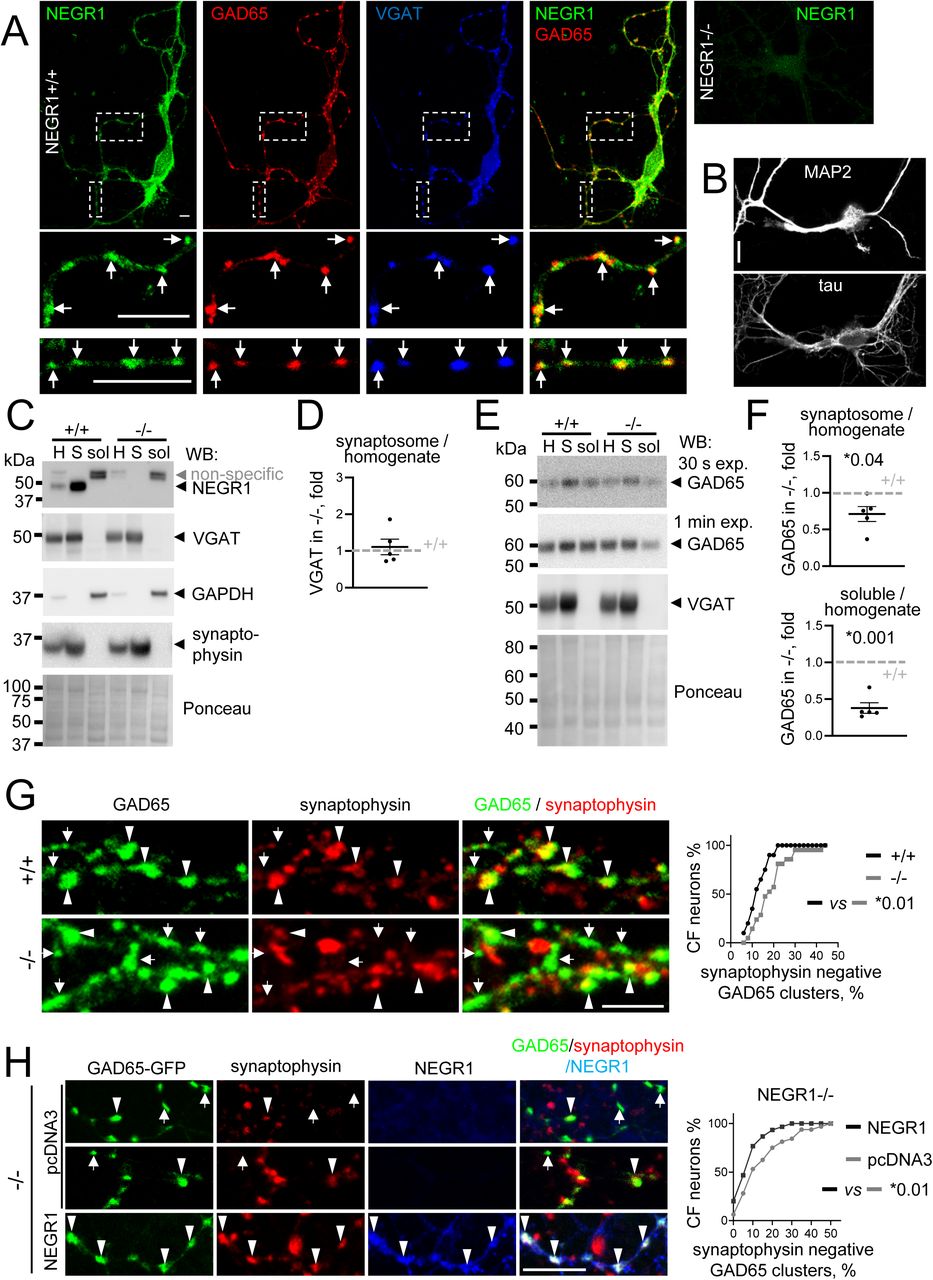
Goat Polyclonal Antibodies Against Negr1, supplied by R&D Systems, used in various techniques. Bioz Stars score: 93/100, based on 1 PubMed citations. ZERO BIAS - scores, article reviews, protocol conditions and more
https://www.bioz.com/result/goat polyclonal antibodies against negr1/product/R&D Systems
Average 93 stars, based on 1 article reviews
goat polyclonal antibodies against negr1 - by Bioz Stars, 2026-03
93/100 stars
  Buy from Supplier

94
Proteintech anti negr1
(A) <t>NEGR1+/+</t> cultured hypothalamic neuron immunolabelled for NEGR1, GAD65 and VGAT. Magnified images of the outlined areas show examples of NEGR1 clusters overlapping with GAD65 and VGAT accumulations (arrows). NEGR1-/- neurons were labelled for control. Bars, 10 µm. (B) NEGR1+/+ cultured hypothalamic neurons immunolabelled for a dendritic marker protein MAP2 and axonal marker protein tau. Bar, 20 µm. (C-F) Western blot (WB) analysis of VGAT ( C, D ) and GAD65 ( E, F ) in NEGR1+/+ and NEGR1-/- brain homogenates (H), synaptosomes (S) and soluble protein (sol) fractions. NEGR1 labelling was included in ( C ) to illustrate its enrichment in synaptosomes. Two different exposures of GAD65 labelling in ( E ) are shown to better illustrate a reduction in GAD65 levels in NEGR1-/- synaptosomes and soluble protein fractions. Labelling for GAPDH and Ponceau stain was used to control loading. Labelling for synaptophysin was used to confirm the efficiency of synaptosome isolation. Graphs show mean ± SEM changes in protein enrichment in NEGR1-/- synaptosomes and soluble protein fractions vs enrichment in NEGR1+/+ samples set to 1. n = 5 pairs of NEGR1+/+ and NEGR1-/- mice were analyzed. *p, one sample t test vs +/+. ( G ) NEGR1+/+ and NEGR1-/- cultured hypothalamic neurons immunolabeled for GAD65 and synaptophysin. ( H ) NEGR1-/- cultured hypothalamic neurons transfected with GAD65-GFP and pcDNA3 or NEGR1 immunolabelled for synaptophysin and NEGR1. In G , H , examples of synaptophysin positive (arrowheads) and negative (arrows) GAD65 clusters are shown. Bars, 5 µm. Graphs show cumulative frequency (CF) of neurons with different percentages of synaptophysin negative GAD65 clusters. *p, Mann-Whitney test (n = 20 ( G ) and 30 ( H ) neurons per group). Figure 1 source data. Contains uncropped Western blot source data for Figure 1.
Anti Negr1, supplied by Proteintech, used in various techniques. Bioz Stars score: 94/100, based on 1 PubMed citations. ZERO BIAS - scores, article reviews, protocol conditions and more
https://www.bioz.com/result/anti negr1/product/Proteintech
Average 94 stars, based on 1 article reviews
anti negr1 - by Bioz Stars, 2026-03
94/100 stars
  Buy from Supplier

92
St Johns Laboratory iglon4
Membrane proteins identified as bona-fide IgLON5 interactors.
Iglon4, supplied by St Johns Laboratory, used in various techniques. Bioz Stars score: 92/100, based on 1 PubMed citations. ZERO BIAS - scores, article reviews, protocol conditions and more
https://www.bioz.com/result/iglon4/product/St Johns Laboratory
Average 92 stars, based on 1 article reviews
iglon4 - by Bioz Stars, 2026-03
92/100 stars
  Buy from Supplier

93
Santa Cruz Biotechnology negr1
Characterization of glycosyl moieties of neuronal growth regulator 1 <t>(NEGR1).</t> ( A ) Schematic diagram of putative N - and O -glycosylation sites in NEGR1. S.S., Signal sequence; D1-3, Ig-like domains; GPI, glycosylphosphatidylinositol-anchoring site. ( B ) After transfection of FLAG-NEGR1, 293 cells were further incubated with different concentration of tunicamycin (Tu) or swainsonine (SW) for 2 h. ( C ) After transfection of FLAG-NEGR1 plasmids, 293T cell lysates were incubated with peptide N -glycosidase F (PNGase F), N -neuraminidase, or O -glycosidase for 90 min. ( D ) Western blotting of NEGR1 proteins that mutated at putative O -glycosylation sites. ( E ) At 24 h post-transfection of FLAG-NEGR1, cell lysates were obtained and incubated with PNGase F or Endo H for 90 min at 37 °C. ( F ) After transfection with FLAG-NEGR1 for 24 h, HeLa cells were further incubated with 5 µM brefeldin A (BFA) prior to enzyme digestion. ( G ) Enzymatic deglycosylation using mouse brain tissues obtained from 11-week-old male C57BL/6 mice.
Negr1, supplied by Santa Cruz Biotechnology, used in various techniques. Bioz Stars score: 93/100, based on 1 PubMed citations. ZERO BIAS - scores, article reviews, protocol conditions and more
https://www.bioz.com/result/negr1/product/Santa Cruz Biotechnology
Average 93 stars, based on 1 article reviews
negr1 - by Bioz Stars, 2026-03
93/100 stars
  Buy from Supplier

91
Thermo Fisher gene exp negr1 mm01317328 m1
Characterization of glycosyl moieties of neuronal growth regulator 1 <t>(NEGR1).</t> ( A ) Schematic diagram of putative N - and O -glycosylation sites in NEGR1. S.S., Signal sequence; D1-3, Ig-like domains; GPI, glycosylphosphatidylinositol-anchoring site. ( B ) After transfection of FLAG-NEGR1, 293 cells were further incubated with different concentration of tunicamycin (Tu) or swainsonine (SW) for 2 h. ( C ) After transfection of FLAG-NEGR1 plasmids, 293T cell lysates were incubated with peptide N -glycosidase F (PNGase F), N -neuraminidase, or O -glycosidase for 90 min. ( D ) Western blotting of NEGR1 proteins that mutated at putative O -glycosylation sites. ( E ) At 24 h post-transfection of FLAG-NEGR1, cell lysates were obtained and incubated with PNGase F or Endo H for 90 min at 37 °C. ( F ) After transfection with FLAG-NEGR1 for 24 h, HeLa cells were further incubated with 5 µM brefeldin A (BFA) prior to enzyme digestion. ( G ) Enzymatic deglycosylation using mouse brain tissues obtained from 11-week-old male C57BL/6 mice.
Gene Exp Negr1 Mm01317328 M1, supplied by Thermo Fisher, used in various techniques. Bioz Stars score: 91/100, based on 1 PubMed citations. ZERO BIAS - scores, article reviews, protocol conditions and more
https://www.bioz.com/result/gene exp negr1 mm01317328 m1/product/Thermo Fisher
Average 91 stars, based on 1 article reviews
gene exp negr1 mm01317328 m1 - by Bioz Stars, 2026-03
91/100 stars
  Buy from Supplier

91
Cusabio negr1
FIGURE 1 The IL-6 mRNA levels were increased in the eWAT of <t>Negr1−/−mice</t> (A) Quantitative RT-PCR was performed to measure the mRNA expression levels of indicated genes using total RNA isolated from the epididymal WAT (eWAT) of 11-week-old WT and Negr1−/−C57BL6 mice (n = 8). The data represent mean ± SEM. **p < 0.01, ***p < 0.001. GAPDH, glyceraldehyde 3-phosphate dehydrogenase. (B) Quantitative RT-PCR analyses using total RNA obtained from bone-marrow-derived macrophages (n = 4). *p < 0.05. (C) Immunostaining of macrophages in eWAT. The paraffin-embedded WAT tissue sections were incubated with anti-F4/80 (red) and anti-CD80 (green) antibodies. Imaging was performed using an Olympus BX51 microscope. Fluorescence intensities were determined using ImageJ software. ***p < 0.001. (D, E) After blood samples were collected from 12-week-old mice (n = 8), the levels of IL-6 (D) and sIL-6R(E) were determined using the ELISA kit. The data represent mean ± SEM. *p < 0.05.
Negr1, supplied by Cusabio, used in various techniques. Bioz Stars score: 91/100, based on 1 PubMed citations. ZERO BIAS - scores, article reviews, protocol conditions and more
https://www.bioz.com/result/negr1/product/Cusabio
Average 91 stars, based on 1 article reviews
negr1 - by Bioz Stars, 2026-03
91/100 stars
  Buy from Supplier

93
OriGene iglon4
FIGURE 1 The IL-6 mRNA levels were increased in the eWAT of <t>Negr1−/−mice</t> (A) Quantitative RT-PCR was performed to measure the mRNA expression levels of indicated genes using total RNA isolated from the epididymal WAT (eWAT) of 11-week-old WT and Negr1−/−C57BL6 mice (n = 8). The data represent mean ± SEM. **p < 0.01, ***p < 0.001. GAPDH, glyceraldehyde 3-phosphate dehydrogenase. (B) Quantitative RT-PCR analyses using total RNA obtained from bone-marrow-derived macrophages (n = 4). *p < 0.05. (C) Immunostaining of macrophages in eWAT. The paraffin-embedded WAT tissue sections were incubated with anti-F4/80 (red) and anti-CD80 (green) antibodies. Imaging was performed using an Olympus BX51 microscope. Fluorescence intensities were determined using ImageJ software. ***p < 0.001. (D, E) After blood samples were collected from 12-week-old mice (n = 8), the levels of IL-6 (D) and sIL-6R(E) were determined using the ELISA kit. The data represent mean ± SEM. *p < 0.05.
Iglon4, supplied by OriGene, used in various techniques. Bioz Stars score: 93/100, based on 1 PubMed citations. ZERO BIAS - scores, article reviews, protocol conditions and more
https://www.bioz.com/result/iglon4/product/OriGene
Average 93 stars, based on 1 article reviews
iglon4 - by Bioz Stars, 2026-03
93/100 stars
  Buy from Supplier

91
Thermo Fisher gene exp negr1 rn00572380 m1
Primer and probes
Gene Exp Negr1 Rn00572380 M1, supplied by Thermo Fisher, used in various techniques. Bioz Stars score: 91/100, based on 1 PubMed citations. ZERO BIAS - scores, article reviews, protocol conditions and more
https://www.bioz.com/result/gene exp negr1 rn00572380 m1/product/Thermo Fisher
Average 91 stars, based on 1 article reviews
gene exp negr1 rn00572380 m1 - by Bioz Stars, 2026-03
91/100 stars
  Buy from Supplier

93
Boster Bio negr1
Differentially expressed genes and Kyoto Encyclopedia of Genes and Genomes analysis. Volcano plots showing the top twenty up- or downregulated genes for each cell type. The red dots represent upregulated genes, and the blue dots represent downregulated genes. ( P value < 0.05, and |log2foldchange| > 0.58). Bubble plot indicating the top enriched pathways for each cell type based on KEGGpathway enrichment analysis of differentially expressed genes( www.kegg.jp/kegg/kegg1.html ). The sizes of the dots represent the number of genes included in each pathway. The colour gradient of dots represents the adjusted P values of each enriched pathway. The genes Pfkfb3 , Tbc1d1 and the insulin signaling pathway; Pdgfd and the PI3K-Akt signaling pathway; Cxcr2 and PLD, Rap1 signaling pathways; Ccl21 and chemical carcinogenesis-reactive oxygen species signaling pathway; Mef2c and the calcium signaling pathway; <t>Negr1</t> and leukocyte transendothelial migration signaling pathway are labelled by the black and red bars in Panels a , b , c , d , e , and f .
Negr1, supplied by Boster Bio, used in various techniques. Bioz Stars score: 93/100, based on 1 PubMed citations. ZERO BIAS - scores, article reviews, protocol conditions and more
https://www.bioz.com/result/negr1/product/Boster Bio
Average 93 stars, based on 1 article reviews
negr1 - by Bioz Stars, 2026-03
93/100 stars
  Buy from Supplier

91
Thermo Fisher copy number variation negr1 hs06530590 cn
Copy number variants selected in five genes and four intergenic regions.
Copy Number Variation Negr1 Hs06530590 Cn, supplied by Thermo Fisher, used in various techniques. Bioz Stars score: 91/100, based on 1 PubMed citations. ZERO BIAS - scores, article reviews, protocol conditions and more
https://www.bioz.com/result/copy number variation negr1 hs06530590 cn/product/Thermo Fisher
Average 91 stars, based on 1 article reviews
copy number variation negr1 hs06530590 cn - by Bioz Stars, 2026-03
91/100 stars
  Buy from Supplier

90
Genechem pc- negr1
Prediction of <t>NEGR1</t> downstream pathway and its impact on the tumor immune microenvironment. A Results of KEGG enrichment analysis and GO (including Biological process, Cellular component, and Molecular function) enrichment analysis of common differential genes; B Results of GSEA enrichment analysis of the two mRNA datasets; C TIMER database analysis of the relationship between differential expression of NEGR1 and macrophage polarization
Pc Negr1, supplied by Genechem, used in various techniques. Bioz Stars score: 90/100, based on 1 PubMed citations. ZERO BIAS - scores, article reviews, protocol conditions and more
https://www.bioz.com/result/pc- negr1/product/Genechem
Average 90 stars, based on 1 article reviews
pc- negr1 - by Bioz Stars, 2026-03
90/100 stars
  Buy from Supplier

Image Search Results


(A) NEGR1+/+ cultured hypothalamic neuron immunolabelled for NEGR1, GAD65 and VGAT. Magnified images of the outlined areas show examples of NEGR1 clusters overlapping with GAD65 and VGAT accumulations (arrows). NEGR1-/- neurons were labelled for control. Bars, 10 µm. (B) NEGR1+/+ cultured hypothalamic neurons immunolabelled for a dendritic marker protein MAP2 and axonal marker protein tau. Bar, 20 µm. (C-F) Western blot (WB) analysis of VGAT ( C, D ) and GAD65 ( E, F ) in NEGR1+/+ and NEGR1-/- brain homogenates (H), synaptosomes (S) and soluble protein (sol) fractions. NEGR1 labelling was included in ( C ) to illustrate its enrichment in synaptosomes. Two different exposures of GAD65 labelling in ( E ) are shown to better illustrate a reduction in GAD65 levels in NEGR1-/- synaptosomes and soluble protein fractions. Labelling for GAPDH and Ponceau stain was used to control loading. Labelling for synaptophysin was used to confirm the efficiency of synaptosome isolation. Graphs show mean ± SEM changes in protein enrichment in NEGR1-/- synaptosomes and soluble protein fractions vs enrichment in NEGR1+/+ samples set to 1. n = 5 pairs of NEGR1+/+ and NEGR1-/- mice were analyzed. *p, one sample t test vs +/+. ( G ) NEGR1+/+ and NEGR1-/- cultured hypothalamic neurons immunolabeled for GAD65 and synaptophysin. ( H ) NEGR1-/- cultured hypothalamic neurons transfected with GAD65-GFP and pcDNA3 or NEGR1 immunolabelled for synaptophysin and NEGR1. In G , H , examples of synaptophysin positive (arrowheads) and negative (arrows) GAD65 clusters are shown. Bars, 5 µm. Graphs show cumulative frequency (CF) of neurons with different percentages of synaptophysin negative GAD65 clusters. *p, Mann-Whitney test (n = 20 ( G ) and 30 ( H ) neurons per group). Figure 1 source data. Contains uncropped Western blot source data for Figure 1.

Journal: bioRxiv

Article Title: Neuronal growth regulator 1 (NEGR1) promotes synaptic targeting of glutamic acid decarboxylase 65 (GAD65)

doi: 10.1101/2022.02.08.479601

Figure Lengend Snippet: (A) NEGR1+/+ cultured hypothalamic neuron immunolabelled for NEGR1, GAD65 and VGAT. Magnified images of the outlined areas show examples of NEGR1 clusters overlapping with GAD65 and VGAT accumulations (arrows). NEGR1-/- neurons were labelled for control. Bars, 10 µm. (B) NEGR1+/+ cultured hypothalamic neurons immunolabelled for a dendritic marker protein MAP2 and axonal marker protein tau. Bar, 20 µm. (C-F) Western blot (WB) analysis of VGAT ( C, D ) and GAD65 ( E, F ) in NEGR1+/+ and NEGR1-/- brain homogenates (H), synaptosomes (S) and soluble protein (sol) fractions. NEGR1 labelling was included in ( C ) to illustrate its enrichment in synaptosomes. Two different exposures of GAD65 labelling in ( E ) are shown to better illustrate a reduction in GAD65 levels in NEGR1-/- synaptosomes and soluble protein fractions. Labelling for GAPDH and Ponceau stain was used to control loading. Labelling for synaptophysin was used to confirm the efficiency of synaptosome isolation. Graphs show mean ± SEM changes in protein enrichment in NEGR1-/- synaptosomes and soluble protein fractions vs enrichment in NEGR1+/+ samples set to 1. n = 5 pairs of NEGR1+/+ and NEGR1-/- mice were analyzed. *p, one sample t test vs +/+. ( G ) NEGR1+/+ and NEGR1-/- cultured hypothalamic neurons immunolabeled for GAD65 and synaptophysin. ( H ) NEGR1-/- cultured hypothalamic neurons transfected with GAD65-GFP and pcDNA3 or NEGR1 immunolabelled for synaptophysin and NEGR1. In G , H , examples of synaptophysin positive (arrowheads) and negative (arrows) GAD65 clusters are shown. Bars, 5 µm. Graphs show cumulative frequency (CF) of neurons with different percentages of synaptophysin negative GAD65 clusters. *p, Mann-Whitney test (n = 20 ( G ) and 30 ( H ) neurons per group). Figure 1 source data. Contains uncropped Western blot source data for Figure 1.

Article Snippet: Goat polyclonal antibodies against NEGR1 (AF5394) used for immunocytochemistry (IC: 1:100) and immunohistochemistry (IHC: 1:1000) were from R&D systems.

Techniques: Cell Culture, Control, Marker, Western Blot, Staining, Isolation, Protein Enrichment, Immunolabeling, Transfection, MANN-WHITNEY

(A) NEGR1+/+ cultured hypothalamic neurons treated with recombinant soluble NEGR1 (sNEGR1) or mock-treated with the culture medium (control) immunolabeled for GAD65 and synaptophysin. Bar, 5 µm. Graph shows mean + SEM levels of GAD65 in synaptophysin accumulations relative to the mean value of the control set to 100% (n > 1000 boutons analyzed per group). *p, one-way ANOVA and Dunnett’s multiple comparisons test (compared to control). (B) Western blot (WB) analysis of GAD65 levels in homogenates (H), synaptosomes (S) and soluble protein fractions (sol) from hypothalamic tissues treated with BSA (control) or sNEGR1. GAPDH and synaptophysin served as loading controls. Graphs show mean ± SEM GAD65 levels in sNEGR1-treated tissues relative to GAD65 levels in the control set to 100% from n = 3 independent experiments. *p, one sample t test vs control. (C) Concentration of GABA in synaptosomes from hypothalamic tissues treated with BSA (control) or sNEGR1 (n = 7). *p, t test. Figure 2 source data. Contains uncropped Western blot source data for Figure 2.

Journal: bioRxiv

Article Title: Neuronal growth regulator 1 (NEGR1) promotes synaptic targeting of glutamic acid decarboxylase 65 (GAD65)

doi: 10.1101/2022.02.08.479601

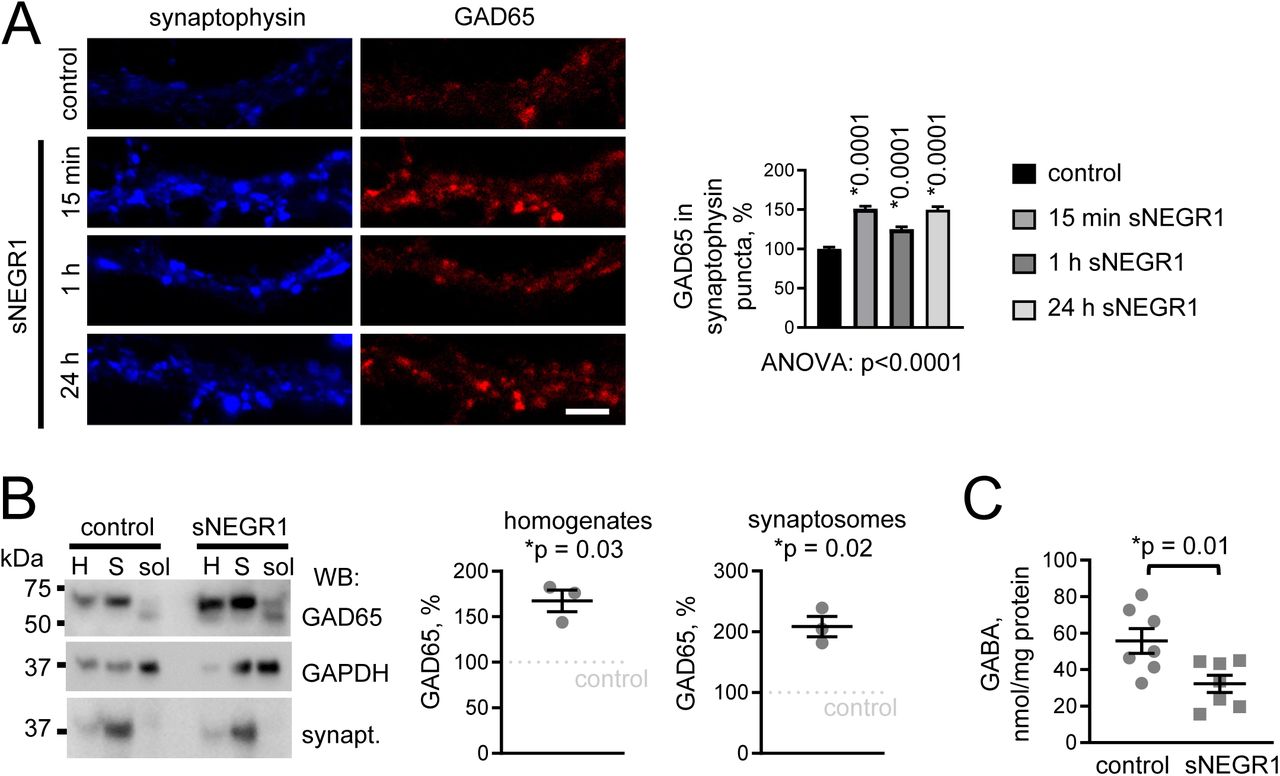
Figure Lengend Snippet: (A) NEGR1+/+ cultured hypothalamic neurons treated with recombinant soluble NEGR1 (sNEGR1) or mock-treated with the culture medium (control) immunolabeled for GAD65 and synaptophysin. Bar, 5 µm. Graph shows mean + SEM levels of GAD65 in synaptophysin accumulations relative to the mean value of the control set to 100% (n > 1000 boutons analyzed per group). *p, one-way ANOVA and Dunnett’s multiple comparisons test (compared to control). (B) Western blot (WB) analysis of GAD65 levels in homogenates (H), synaptosomes (S) and soluble protein fractions (sol) from hypothalamic tissues treated with BSA (control) or sNEGR1. GAPDH and synaptophysin served as loading controls. Graphs show mean ± SEM GAD65 levels in sNEGR1-treated tissues relative to GAD65 levels in the control set to 100% from n = 3 independent experiments. *p, one sample t test vs control. (C) Concentration of GABA in synaptosomes from hypothalamic tissues treated with BSA (control) or sNEGR1 (n = 7). *p, t test. Figure 2 source data. Contains uncropped Western blot source data for Figure 2.

Article Snippet: Goat polyclonal antibodies against NEGR1 (AF5394) used for immunocytochemistry (IC: 1:100) and immunohistochemistry (IHC: 1:1000) were from R&D systems.

Techniques: Cell Culture, Recombinant, Control, Immunolabeling, Western Blot, Concentration Assay

(A-D) Synaptic vesicles in cultured hypothalamic neurons were loaded with FM4-64 applied for 2 min in 47 mM K+ buffer (0 s). Time lapse images show release of the dye in response to the electric field stimulation. Bar, 5 μm. Graphs show FM4-64 uptake at 0 s, changes in FM4-64 levels (ΔF/F) in synaptic boutons over time during the stimulation, and half-life of FM4-64 loss during the stimulation (mean ± SEM, *p, Mann-Whitney test). (A) NEGR1+/+ neurons (n = 113 boutons from 10 neurons) and NEGR1-/- neurons (n = 108 boutons from 10 neurons). (B, C) NEGR1+/+ neurons co-transfected with GFP and pcDNA3 or NEGR1. Axons ( B, n = 418 boutons from 10 pcDNA3-transfected neurons, 266 boutons from 12 NEGR1-transfected neurons) and dendrites ( C , n = 376 boutons from 12 pcDNA3-transfected neurons, 261 boutons from 13 NEGR1- transfected neurons). (D) NEGR1+/+ neurons treated with control non-specific immunoglobulins (Ig, n = 681 boutons from 10 neurons) or NEGR1 antibodies (NEGR1 Ab, n = 514 boutons from 10 neurons).

Journal: bioRxiv

Article Title: Neuronal growth regulator 1 (NEGR1) promotes synaptic targeting of glutamic acid decarboxylase 65 (GAD65)

doi: 10.1101/2022.02.08.479601

Figure Lengend Snippet: (A-D) Synaptic vesicles in cultured hypothalamic neurons were loaded with FM4-64 applied for 2 min in 47 mM K+ buffer (0 s). Time lapse images show release of the dye in response to the electric field stimulation. Bar, 5 μm. Graphs show FM4-64 uptake at 0 s, changes in FM4-64 levels (ΔF/F) in synaptic boutons over time during the stimulation, and half-life of FM4-64 loss during the stimulation (mean ± SEM, *p, Mann-Whitney test). (A) NEGR1+/+ neurons (n = 113 boutons from 10 neurons) and NEGR1-/- neurons (n = 108 boutons from 10 neurons). (B, C) NEGR1+/+ neurons co-transfected with GFP and pcDNA3 or NEGR1. Axons ( B, n = 418 boutons from 10 pcDNA3-transfected neurons, 266 boutons from 12 NEGR1-transfected neurons) and dendrites ( C , n = 376 boutons from 12 pcDNA3-transfected neurons, 261 boutons from 13 NEGR1- transfected neurons). (D) NEGR1+/+ neurons treated with control non-specific immunoglobulins (Ig, n = 681 boutons from 10 neurons) or NEGR1 antibodies (NEGR1 Ab, n = 514 boutons from 10 neurons).

Article Snippet: Goat polyclonal antibodies against NEGR1 (AF5394) used for immunocytochemistry (IC: 1:100) and immunohistochemistry (IHC: 1:1000) were from R&D systems.

Techniques: Cell Culture, MANN-WHITNEY, Transfection, Control

(A, B) NEGR1+/+ cultured hypothalamic neurons treated with sNEGR1 and dynasore ( A ) or TetTx ( B ) as indicated. Control neurons were mock treated with vehicle (DMSO in A , water in B ). Neurons were immunolabeled for GAD65 and synaptophysin. Examples of synaptophysin positive (arrows) and negative (arrowheads) GAD65 clusters are shown. Bars, 5 µm. Graphs show cumulative frequency (CF) of neurons with increasing percentages of synaptophysin negative GAD65 clusters. *p, Mann-Whitney test (n = 20-26 neurons per group). (C, D) sNEGR1-treated and control culture medium-treated NEGR1+/+ cultured hypothalamic neurons incubated live with antibodies against the lumenal domain of VGAT. The antibodies were detected with secondary antibodies applied before (VGAT surface_remaining ) and after (VGAT surface_delivered ) permeabilization of membranes with detergent. Neurons were co-labelled with antibodies against the cytoplasmic domain of VGAT (VGAT synaptic ). Bar, 5 μm. Graphs show mean + SEM labelling intensities of VGAT synaptic and VGAT surface_delivered ( C ), VGAT surface_remaining ( D ), and their ratios (n = 40 neurons in C , 20 neurons in D ). Control mean intensity was set to 100%. (E) Western blot analysis of GAD65 levels in synaptic PM from hypothalamic tissues treated with BSA or sNEGR1 applied either alone (cont.) or together with dynasore (dyn.) or TetTx. NCAM1 served as loading control. Graph shows mean ± SEM GAD65 levels relative to the levels in BSA only treated tissues set to 100% from n = 3 independent experiments. Samples from each experiment were analyzed by Western blot twice and the data were averaged. *p, one sample t test vs BSA only treated tissues. Figure 4 source data. Contains uncropped Western blot source data for Figure 4.

Journal: bioRxiv

Article Title: Neuronal growth regulator 1 (NEGR1) promotes synaptic targeting of glutamic acid decarboxylase 65 (GAD65)

doi: 10.1101/2022.02.08.479601

Figure Lengend Snippet: (A, B) NEGR1+/+ cultured hypothalamic neurons treated with sNEGR1 and dynasore ( A ) or TetTx ( B ) as indicated. Control neurons were mock treated with vehicle (DMSO in A , water in B ). Neurons were immunolabeled for GAD65 and synaptophysin. Examples of synaptophysin positive (arrows) and negative (arrowheads) GAD65 clusters are shown. Bars, 5 µm. Graphs show cumulative frequency (CF) of neurons with increasing percentages of synaptophysin negative GAD65 clusters. *p, Mann-Whitney test (n = 20-26 neurons per group). (C, D) sNEGR1-treated and control culture medium-treated NEGR1+/+ cultured hypothalamic neurons incubated live with antibodies against the lumenal domain of VGAT. The antibodies were detected with secondary antibodies applied before (VGAT surface_remaining ) and after (VGAT surface_delivered ) permeabilization of membranes with detergent. Neurons were co-labelled with antibodies against the cytoplasmic domain of VGAT (VGAT synaptic ). Bar, 5 μm. Graphs show mean + SEM labelling intensities of VGAT synaptic and VGAT surface_delivered ( C ), VGAT surface_remaining ( D ), and their ratios (n = 40 neurons in C , 20 neurons in D ). Control mean intensity was set to 100%. (E) Western blot analysis of GAD65 levels in synaptic PM from hypothalamic tissues treated with BSA or sNEGR1 applied either alone (cont.) or together with dynasore (dyn.) or TetTx. NCAM1 served as loading control. Graph shows mean ± SEM GAD65 levels relative to the levels in BSA only treated tissues set to 100% from n = 3 independent experiments. Samples from each experiment were analyzed by Western blot twice and the data were averaged. *p, one sample t test vs BSA only treated tissues. Figure 4 source data. Contains uncropped Western blot source data for Figure 4.

Article Snippet: Goat polyclonal antibodies against NEGR1 (AF5394) used for immunocytochemistry (IC: 1:100) and immunohistochemistry (IHC: 1:1000) were from R&D systems.

Techniques: Cell Culture, Control, Immunolabeling, MANN-WHITNEY, Incubation, Western Blot

(A) Diagram illustrating the principle of detection of the PM attachment of GAD65 using BiFC. (B) LCK-VN-transfected CHO cell labelled with VN-recognizing GFP antibodies and co-labelled for GM130. (C) BiFC assay with CHO cells co-transfected with LCK-VN and GAD65-VC proteins shown on the diagram. Immunolabelling for GAD65 was used for normalization. Graph shows mean ± SEM BiFC / GAD65 ratio. *p, one-way ANOVA and Dunnett’s multiple comparisons test (n = 15 cells per group). (D) BiFC fluorescence distribution in the XY confocal slice and ZX and ZY sections along the dashed lines through the 3D reconstructed GAD65WT-VC-co-transfected cell shown in C . Note PM localization of the BiFC signals in ZX and ZY sections. Arrowheads show vesicle-like structures at the PM. (E) CHO cells co-transfected with LCK-VN, GAD65WT-VC and either pcDNA3 or NEGR1. Cells were co-labelled for NEGR1. Arrows show clusters of NEGR1 co-localized with BiFC signals. (F) CHO cell co-transfected with LCK-VN and GAD65WT-VC co-labelled for clathrin. Arrowheads in ZX and ZY sections through the 3D reconstructed cell show BiFC signals co-localized with clathrin accumulations at the PM. (G) FM4-64 loaded vesicles in CHO cells co-transfected with GAD65-GFP and either pcDNA3 or NEGR1. High magnification images show areas outlined with dashed boxes. Arrows show examples of FM-loaded vesicles co-localized with GAD65-GFP. Graph shows mean ± SEM percentages of FM- loaded vesicles co-localized with GAD65-GFP and FM4-64 levels. *p, Mann-Whitney test (n = 42 cells per group). Bars, 20 µm (low magnification), 5 µm (high magnification) (B-G) .

Journal: bioRxiv

Article Title: Neuronal growth regulator 1 (NEGR1) promotes synaptic targeting of glutamic acid decarboxylase 65 (GAD65)

doi: 10.1101/2022.02.08.479601

Figure Lengend Snippet: (A) Diagram illustrating the principle of detection of the PM attachment of GAD65 using BiFC. (B) LCK-VN-transfected CHO cell labelled with VN-recognizing GFP antibodies and co-labelled for GM130. (C) BiFC assay with CHO cells co-transfected with LCK-VN and GAD65-VC proteins shown on the diagram. Immunolabelling for GAD65 was used for normalization. Graph shows mean ± SEM BiFC / GAD65 ratio. *p, one-way ANOVA and Dunnett’s multiple comparisons test (n = 15 cells per group). (D) BiFC fluorescence distribution in the XY confocal slice and ZX and ZY sections along the dashed lines through the 3D reconstructed GAD65WT-VC-co-transfected cell shown in C . Note PM localization of the BiFC signals in ZX and ZY sections. Arrowheads show vesicle-like structures at the PM. (E) CHO cells co-transfected with LCK-VN, GAD65WT-VC and either pcDNA3 or NEGR1. Cells were co-labelled for NEGR1. Arrows show clusters of NEGR1 co-localized with BiFC signals. (F) CHO cell co-transfected with LCK-VN and GAD65WT-VC co-labelled for clathrin. Arrowheads in ZX and ZY sections through the 3D reconstructed cell show BiFC signals co-localized with clathrin accumulations at the PM. (G) FM4-64 loaded vesicles in CHO cells co-transfected with GAD65-GFP and either pcDNA3 or NEGR1. High magnification images show areas outlined with dashed boxes. Arrows show examples of FM-loaded vesicles co-localized with GAD65-GFP. Graph shows mean ± SEM percentages of FM- loaded vesicles co-localized with GAD65-GFP and FM4-64 levels. *p, Mann-Whitney test (n = 42 cells per group). Bars, 20 µm (low magnification), 5 µm (high magnification) (B-G) .

Article Snippet: Goat polyclonal antibodies against NEGR1 (AF5394) used for immunocytochemistry (IC: 1:100) and immunohistochemistry (IHC: 1:1000) were from R&D systems.

Techniques: Transfection, Bimolecular Fluorescence Complementation Assay, Fluorescence, MANN-WHITNEY

(A, B) CHO cells transfected with pcDNA3 or NEGR1 were either co-transfected with mCherry-D4H to visualize cholesterol (A) or immunolabelled for ganglioside GM4 (B) . Bars, 20 µm. Graphs show ratios of D4H and GM4 labelling levels at the PM and in cytoplasm (mean + SEM, n = 20). *p, Mann Whitney test. (C) Lipid raft markers gangliosides GM4 and GD3 and phosphatidylinositol 4,5-bisphosphate (PIP2) analyzed in triplicate by dot blot in brain homogenates (BH) and synaptosomes (synapt.) from a representative pair of NEGR1+/+ and NEGR1-/- littermates. Graphs show mean + SEM synaptic enrichments of the lipids in NEGR1-/- mice relative to the levels in NEGR1+/+ mice set to 1. n = 5 pairs of NEGR1+/+ and NEGR1-/- mice were analyzed. *p, one sample t test vs +/+. Figure 6 source data. Contains dot blot source data for Figure 6.

Journal: bioRxiv

Article Title: Neuronal growth regulator 1 (NEGR1) promotes synaptic targeting of glutamic acid decarboxylase 65 (GAD65)

doi: 10.1101/2022.02.08.479601

Figure Lengend Snippet: (A, B) CHO cells transfected with pcDNA3 or NEGR1 were either co-transfected with mCherry-D4H to visualize cholesterol (A) or immunolabelled for ganglioside GM4 (B) . Bars, 20 µm. Graphs show ratios of D4H and GM4 labelling levels at the PM and in cytoplasm (mean + SEM, n = 20). *p, Mann Whitney test. (C) Lipid raft markers gangliosides GM4 and GD3 and phosphatidylinositol 4,5-bisphosphate (PIP2) analyzed in triplicate by dot blot in brain homogenates (BH) and synaptosomes (synapt.) from a representative pair of NEGR1+/+ and NEGR1-/- littermates. Graphs show mean + SEM synaptic enrichments of the lipids in NEGR1-/- mice relative to the levels in NEGR1+/+ mice set to 1. n = 5 pairs of NEGR1+/+ and NEGR1-/- mice were analyzed. *p, one sample t test vs +/+. Figure 6 source data. Contains dot blot source data for Figure 6.

Article Snippet: Goat polyclonal antibodies against NEGR1 (AF5394) used for immunocytochemistry (IC: 1:100) and immunohistochemistry (IHC: 1:1000) were from R&D systems.

Techniques: Transfection, MANN-WHITNEY, Dot Blot

( A ) Neurites of NEGR1+/+ cultured hypothalamic neurons immunolabelled for NEGR1, GAD65 and NPY. Arrows show examples of NEGR1 clusters overlapping with NPY positive GAD65 accumulations. Open arrowheads show NPY negative GAD65 accumulations with lower levels of NEGR1. Bar, 5 µm. Graph shows mean ± SEM levels of NEGR1 in NPY positive (+) and negative (-) GAD65 accumulations (n > 100). AU – arbitrary units defined as pixel values of 16-bit gray scale images. *p, unpaired t test. ( B, C ) Confocal images of the ARC ( B ) and pyramidal cell layer in the hippocampal CA3 region ( C ) in brain sections of NEGR1+/+ and NEGR1-/- littermates immunolabelled for NEGR1, GAD65 and VGAT. Bar, 10 µm. Graphs show mean ± SEM densities of VGAT accumulations. *p, Mann-Whitney test.

Journal: bioRxiv

Article Title: Neuronal growth regulator 1 (NEGR1) promotes synaptic targeting of glutamic acid decarboxylase 65 (GAD65)

doi: 10.1101/2022.02.08.479601

Figure Lengend Snippet: ( A ) Neurites of NEGR1+/+ cultured hypothalamic neurons immunolabelled for NEGR1, GAD65 and NPY. Arrows show examples of NEGR1 clusters overlapping with NPY positive GAD65 accumulations. Open arrowheads show NPY negative GAD65 accumulations with lower levels of NEGR1. Bar, 5 µm. Graph shows mean ± SEM levels of NEGR1 in NPY positive (+) and negative (-) GAD65 accumulations (n > 100). AU – arbitrary units defined as pixel values of 16-bit gray scale images. *p, unpaired t test. ( B, C ) Confocal images of the ARC ( B ) and pyramidal cell layer in the hippocampal CA3 region ( C ) in brain sections of NEGR1+/+ and NEGR1-/- littermates immunolabelled for NEGR1, GAD65 and VGAT. Bar, 10 µm. Graphs show mean ± SEM densities of VGAT accumulations. *p, Mann-Whitney test.

Article Snippet: Goat polyclonal antibodies against NEGR1 (AF5394) used for immunocytochemistry (IC: 1:100) and immunohistochemistry (IHC: 1:1000) were from R&D systems.

Techniques: Cell Culture, MANN-WHITNEY

( A ) Mean ± SEM percentages of pellets eaten over 30 min during magazine training sessions. One pellet was released into the magazine each minute. ( B ) Mean ± SEM numbers of active lever presses and pellets eaten during the fixed ratio task. Each active lever press led to the release of a pellet. ( C ) Individual progressive ratio break point values measured over three consecutive days in the progressive ratio task. Lines connect data for individual mice. Graphs showing data normalized to the values on day 1 set to 100% are included to illustrate an increase in the progressive ratio break point in NEGR1+/+ mice. ( D ) Mean ± SEM of the normalized values shown in C . ( E ) Mean ± SEM numbers of pellets delivered and active lever presses in the progressive ratio task. The numbers of active lever presses were normalized to the number on day 1 set to 100%. In A - E , n = 9 NEGR1+/+, 8 NEGR1+/- and 12 NEGR1-/- mice were analyzed. *p, repeated measures two-way ANOVA and Tukey’s multiple comparisons test.

Journal: bioRxiv

Article Title: Neuronal growth regulator 1 (NEGR1) promotes synaptic targeting of glutamic acid decarboxylase 65 (GAD65)

doi: 10.1101/2022.02.08.479601

Figure Lengend Snippet: ( A ) Mean ± SEM percentages of pellets eaten over 30 min during magazine training sessions. One pellet was released into the magazine each minute. ( B ) Mean ± SEM numbers of active lever presses and pellets eaten during the fixed ratio task. Each active lever press led to the release of a pellet. ( C ) Individual progressive ratio break point values measured over three consecutive days in the progressive ratio task. Lines connect data for individual mice. Graphs showing data normalized to the values on day 1 set to 100% are included to illustrate an increase in the progressive ratio break point in NEGR1+/+ mice. ( D ) Mean ± SEM of the normalized values shown in C . ( E ) Mean ± SEM numbers of pellets delivered and active lever presses in the progressive ratio task. The numbers of active lever presses were normalized to the number on day 1 set to 100%. In A - E , n = 9 NEGR1+/+, 8 NEGR1+/- and 12 NEGR1-/- mice were analyzed. *p, repeated measures two-way ANOVA and Tukey’s multiple comparisons test.

Article Snippet: Goat polyclonal antibodies against NEGR1 (AF5394) used for immunocytochemistry (IC: 1:100) and immunohistochemistry (IHC: 1:1000) were from R&D systems.

Techniques:

(A-C) Western blot (WB) analysis of NEGR1 levels in homogenates (H), synaptosomes (S) and soluble protein fractions (sol) from brains of chow and high fat diet (HFD) fed mice. GAPDH served as loading control. Graphs show levels of full length NEGR1 in brain homogenates and synaptosomes ( B ) and soluble NEGR1 fragments in the soluble protein fraction ( C ) from HFD fed mice relative to the levels in chow diet fed mice set to 100%. n = 3 mice per group. ( D ) WB analysis of the soluble protein fractions from NEGR1+/+ and NEGR1-/- brains with NEGR1 antibodies. Note that the NEGR1 fragment is detected only in the NEGR1+/+ lane. The diagram shows the structure of NEGR1 consisting of three Ig-domains attached to the PM via a GPI anchor. The site recognized by the antibody used for Western blot analysis is marked with a square. ( E ) WB analysis of GAD65 levels in synaptic PM from chow and HFD fed mice. NCAM1 served as loading control. Graph shows levels in HFD membranes relative to chow control set to 100%. n = 3 mice per group. (F) Concentration of GABA in synaptosomes from the brains of chow and HFD fed mice (n = 10). (G) WB analysis of GAD65 levels in homogenates (H), synaptosomes (S) and soluble protein fractions (sol) from brains of chow and HFD fed mice. GAPDH and synaptophysin served as loading controls. Graphs show levels of GAD65 in brain homogenates and synaptosomes of HFD fed mice relative to the levels in chow fed mice set to 100%. n = 3 mice per group. (H) Axons and dendrites of NEGR1+/+ cultured hypothalamic neurons co-transfected with cherry and control pcDNA3 vector or NEGR1. Neurons were immunolabelled for synaptophysin and NEGR1. Note reduced numbers of synaptophysin puncta (arrows) along the axons and dendrites of NEGR1-overexpressing neurons. Bar, 5 µm. Graphs show synaptophysin labelling intensities along dendrites (n = 14 - 24) and axons (n = 31 - 43). Mean of control was set to 100%. In B, C, E-H , mean ± SEM values are shown. *p, one sample t test vs chow ( B, C, E, G ) or Mann Whitney test ( F, H ). Figure 10 source data. Contains uncropped Western blot source data for Figure 10.

Journal: bioRxiv

Article Title: Neuronal growth regulator 1 (NEGR1) promotes synaptic targeting of glutamic acid decarboxylase 65 (GAD65)

doi: 10.1101/2022.02.08.479601

Figure Lengend Snippet: (A-C) Western blot (WB) analysis of NEGR1 levels in homogenates (H), synaptosomes (S) and soluble protein fractions (sol) from brains of chow and high fat diet (HFD) fed mice. GAPDH served as loading control. Graphs show levels of full length NEGR1 in brain homogenates and synaptosomes ( B ) and soluble NEGR1 fragments in the soluble protein fraction ( C ) from HFD fed mice relative to the levels in chow diet fed mice set to 100%. n = 3 mice per group. ( D ) WB analysis of the soluble protein fractions from NEGR1+/+ and NEGR1-/- brains with NEGR1 antibodies. Note that the NEGR1 fragment is detected only in the NEGR1+/+ lane. The diagram shows the structure of NEGR1 consisting of three Ig-domains attached to the PM via a GPI anchor. The site recognized by the antibody used for Western blot analysis is marked with a square. ( E ) WB analysis of GAD65 levels in synaptic PM from chow and HFD fed mice. NCAM1 served as loading control. Graph shows levels in HFD membranes relative to chow control set to 100%. n = 3 mice per group. (F) Concentration of GABA in synaptosomes from the brains of chow and HFD fed mice (n = 10). (G) WB analysis of GAD65 levels in homogenates (H), synaptosomes (S) and soluble protein fractions (sol) from brains of chow and HFD fed mice. GAPDH and synaptophysin served as loading controls. Graphs show levels of GAD65 in brain homogenates and synaptosomes of HFD fed mice relative to the levels in chow fed mice set to 100%. n = 3 mice per group. (H) Axons and dendrites of NEGR1+/+ cultured hypothalamic neurons co-transfected with cherry and control pcDNA3 vector or NEGR1. Neurons were immunolabelled for synaptophysin and NEGR1. Note reduced numbers of synaptophysin puncta (arrows) along the axons and dendrites of NEGR1-overexpressing neurons. Bar, 5 µm. Graphs show synaptophysin labelling intensities along dendrites (n = 14 - 24) and axons (n = 31 - 43). Mean of control was set to 100%. In B, C, E-H , mean ± SEM values are shown. *p, one sample t test vs chow ( B, C, E, G ) or Mann Whitney test ( F, H ). Figure 10 source data. Contains uncropped Western blot source data for Figure 10.

Article Snippet: Goat polyclonal antibodies against NEGR1 (AF5394) used for immunocytochemistry (IC: 1:100) and immunohistochemistry (IHC: 1:1000) were from R&D systems.

Techniques: Western Blot, Control, Concentration Assay, Cell Culture, Transfection, Plasmid Preparation, MANN-WHITNEY

(A) Synaptic vesicle localized GAD65 uses glutamate to synthesize GABA, which is transported to the vesicle lumen by VGAT ( a ). GAD65 is de-palmitoylated and removed to the cytosol from refilled vesicles ( b ), which then fuse with the PM and release GABA. GAD65 released to the cytosol can travel to the Golgi in the neuronal cell body (red arrow, ) or attach to the PM in the synapse ( c ). Palmitoylation of GAD65 at the PM targets it to the NEGR1-containing cholesterol-enriched microdomains, which are anchored in synapses by NEGR1-containing adhesive bonds ( d ). NEGR1-dependent synaptic clustering of lipid rafts promotes ‘loading’ of palmitoylated GAD65 on the newly formed synaptic vesicles ( e ). This loading is facilitated by interactions between NEGR1 containing lipid rafts and components of synaptic vesicles constraining the retrieval of synaptic vesicle membranes. Synaptic recycling of vesicles and GAD65 is shown with black and pink arrows, respectively. (B) In NEGR1+/+ neurons, synaptic clustering of lipid rafts by trans-synaptic NEGR1-containing adhesive bonds promotes synaptic accumulation of GAD65. (C) In NEGR1-/- neurons, synaptic clustering of lipid rafts is reduced, synaptic targeting of GAD65 is inhibited, and non-synaptic GAD65 clusters are formed.

Journal: bioRxiv

Article Title: Neuronal growth regulator 1 (NEGR1) promotes synaptic targeting of glutamic acid decarboxylase 65 (GAD65)

doi: 10.1101/2022.02.08.479601

Figure Lengend Snippet: (A) Synaptic vesicle localized GAD65 uses glutamate to synthesize GABA, which is transported to the vesicle lumen by VGAT ( a ). GAD65 is de-palmitoylated and removed to the cytosol from refilled vesicles ( b ), which then fuse with the PM and release GABA. GAD65 released to the cytosol can travel to the Golgi in the neuronal cell body (red arrow, ) or attach to the PM in the synapse ( c ). Palmitoylation of GAD65 at the PM targets it to the NEGR1-containing cholesterol-enriched microdomains, which are anchored in synapses by NEGR1-containing adhesive bonds ( d ). NEGR1-dependent synaptic clustering of lipid rafts promotes ‘loading’ of palmitoylated GAD65 on the newly formed synaptic vesicles ( e ). This loading is facilitated by interactions between NEGR1 containing lipid rafts and components of synaptic vesicles constraining the retrieval of synaptic vesicle membranes. Synaptic recycling of vesicles and GAD65 is shown with black and pink arrows, respectively. (B) In NEGR1+/+ neurons, synaptic clustering of lipid rafts by trans-synaptic NEGR1-containing adhesive bonds promotes synaptic accumulation of GAD65. (C) In NEGR1-/- neurons, synaptic clustering of lipid rafts is reduced, synaptic targeting of GAD65 is inhibited, and non-synaptic GAD65 clusters are formed.

Article Snippet: Goat polyclonal antibodies against NEGR1 (AF5394) used for immunocytochemistry (IC: 1:100) and immunohistochemistry (IHC: 1:1000) were from R&D systems.

Techniques: Adhesive

Membrane proteins identified as bona-fide IgLON5 interactors.

Journal: Frontiers in Immunology

Article Title: Patients’ IgLON5 autoantibodies interfere with IgLON5-protein interactions

doi: 10.3389/fimmu.2023.1151574

Figure Lengend Snippet: Membrane proteins identified as bona-fide IgLON5 interactors.

Article Snippet: The presence of the interacting proteins was detected by incubating the membrane with the following antibodies (dilution 1:500, overnight at 4°C): IgLON1 (STJ94590), IgLON2 (STJ94442), IgLON3 (STJ116461), IgLON4 (STJ94394, St. John’s Laboratory, London, UK), KIDINS220 (21856-1-AP, Proteintech, Rosemont, IL, USA), IGSF21 (21465-1-AP; Proteintech), CACNA2D2 (SAB1401461, SIGMA) and CASPR2 (ab33994, Abcam) followed by incubation with appropriate secondary antibodies (dilution 1:1000) for 1 hour at room temperature.

Techniques: Membrane

Characterization of glycosyl moieties of neuronal growth regulator 1 (NEGR1). ( A ) Schematic diagram of putative N - and O -glycosylation sites in NEGR1. S.S., Signal sequence; D1-3, Ig-like domains; GPI, glycosylphosphatidylinositol-anchoring site. ( B ) After transfection of FLAG-NEGR1, 293 cells were further incubated with different concentration of tunicamycin (Tu) or swainsonine (SW) for 2 h. ( C ) After transfection of FLAG-NEGR1 plasmids, 293T cell lysates were incubated with peptide N -glycosidase F (PNGase F), N -neuraminidase, or O -glycosidase for 90 min. ( D ) Western blotting of NEGR1 proteins that mutated at putative O -glycosylation sites. ( E ) At 24 h post-transfection of FLAG-NEGR1, cell lysates were obtained and incubated with PNGase F or Endo H for 90 min at 37 °C. ( F ) After transfection with FLAG-NEGR1 for 24 h, HeLa cells were further incubated with 5 µM brefeldin A (BFA) prior to enzyme digestion. ( G ) Enzymatic deglycosylation using mouse brain tissues obtained from 11-week-old male C57BL/6 mice.

Journal: Cells

Article Title: The Role of N -Glycosylation in the Intracellular Trafficking and Functionality of Neuronal Growth Regulator 1

doi: 10.3390/cells11071242

Figure Lengend Snippet: Characterization of glycosyl moieties of neuronal growth regulator 1 (NEGR1). ( A ) Schematic diagram of putative N - and O -glycosylation sites in NEGR1. S.S., Signal sequence; D1-3, Ig-like domains; GPI, glycosylphosphatidylinositol-anchoring site. ( B ) After transfection of FLAG-NEGR1, 293 cells were further incubated with different concentration of tunicamycin (Tu) or swainsonine (SW) for 2 h. ( C ) After transfection of FLAG-NEGR1 plasmids, 293T cell lysates were incubated with peptide N -glycosidase F (PNGase F), N -neuraminidase, or O -glycosidase for 90 min. ( D ) Western blotting of NEGR1 proteins that mutated at putative O -glycosylation sites. ( E ) At 24 h post-transfection of FLAG-NEGR1, cell lysates were obtained and incubated with PNGase F or Endo H for 90 min at 37 °C. ( F ) After transfection with FLAG-NEGR1 for 24 h, HeLa cells were further incubated with 5 µM brefeldin A (BFA) prior to enzyme digestion. ( G ) Enzymatic deglycosylation using mouse brain tissues obtained from 11-week-old male C57BL/6 mice.

Article Snippet: The following antibodies were used: FLAG (mouse monoclonal or rabbit monoclonal) from Sigma-Aldrich; NEGR1, HA, and β -actin from Santa Cruz Biotechnology Inc. (Dallas, TX, USA); Cy3 anti-mouse and Alexa Fluor 594 anti-human IgG from Jackson ImmunoResearch Laboratories (West Grove, PA, USA); and Fluorescein isothiocyanate (FITC) anti-mouse IgG from Invitrogen.

Techniques: Glycoproteomics, Sequencing, Transfection, Incubation, Concentration Assay, Western Blot

Generation of NEGR1 N -glycosylation mutants. ( A ) Immunoblotting of 293T cell lysates expressing N -glycosylation site-specific NEGR1 single mutants. ( B ) Deglycosylation of the NEGR1 6MT mutant, which contained all six N -glycosylation site mutations. The 293T cell lysates expressing wild type (WT) or 6MT NEGR1 were subjected to PNGase F digestion. ( C ) PNGase F digestion of each single N -glycosylation mutants. ( D ) Schematic representation of NEGR1 mutants (2MT–6MT), containing additive mutations in the following order: 286/294, 307, 275, 155, and 75. ( E ) NEGR1 WT and cumulative mutants were transfected into 293T cells and then subjected to enzymatic deglycosylation.

Journal: Cells

Article Title: The Role of N -Glycosylation in the Intracellular Trafficking and Functionality of Neuronal Growth Regulator 1

doi: 10.3390/cells11071242

Figure Lengend Snippet: Generation of NEGR1 N -glycosylation mutants. ( A ) Immunoblotting of 293T cell lysates expressing N -glycosylation site-specific NEGR1 single mutants. ( B ) Deglycosylation of the NEGR1 6MT mutant, which contained all six N -glycosylation site mutations. The 293T cell lysates expressing wild type (WT) or 6MT NEGR1 were subjected to PNGase F digestion. ( C ) PNGase F digestion of each single N -glycosylation mutants. ( D ) Schematic representation of NEGR1 mutants (2MT–6MT), containing additive mutations in the following order: 286/294, 307, 275, 155, and 75. ( E ) NEGR1 WT and cumulative mutants were transfected into 293T cells and then subjected to enzymatic deglycosylation.

Article Snippet: The following antibodies were used: FLAG (mouse monoclonal or rabbit monoclonal) from Sigma-Aldrich; NEGR1, HA, and β -actin from Santa Cruz Biotechnology Inc. (Dallas, TX, USA); Cy3 anti-mouse and Alexa Fluor 594 anti-human IgG from Jackson ImmunoResearch Laboratories (West Grove, PA, USA); and Fluorescein isothiocyanate (FITC) anti-mouse IgG from Invitrogen.

Techniques: Glycoproteomics, Western Blot, Expressing, Mutagenesis, Transfection

N -Glycosylation mutants of  NEGR1.

Journal: Cells

Article Title: The Role of N -Glycosylation in the Intracellular Trafficking and Functionality of Neuronal Growth Regulator 1

doi: 10.3390/cells11071242

Figure Lengend Snippet: N -Glycosylation mutants of NEGR1.

Article Snippet: The following antibodies were used: FLAG (mouse monoclonal or rabbit monoclonal) from Sigma-Aldrich; NEGR1, HA, and β -actin from Santa Cruz Biotechnology Inc. (Dallas, TX, USA); Cy3 anti-mouse and Alexa Fluor 594 anti-human IgG from Jackson ImmunoResearch Laboratories (West Grove, PA, USA); and Fluorescein isothiocyanate (FITC) anti-mouse IgG from Invitrogen.

Techniques: Glycoproteomics, Mutagenesis

Membrane targeting of NEGR1 N -glycosylation mutants. ( A ) Immunofluorescence microscopy analysis of NEGR1 mutants. After transfection, HeLa cells were immunostained with anti-FLAG antibody with or without 0.1% Triton X-100. After incubation with Cy3-conjugated secondary antibody, images were captured using the Olympus BX51 fluorescence microscope. Scale bar = 50 μm. Cell surface expression was determined by calculating the relative fluorescence intensities in non-permeabilized cells after normalization to those in permeabilized cells. **** p < 0.0001. Error bars represent standard deviations (SD). ( B ) After transfection, HeLa cells were labeled with sulfo-NHS-SS-biotin using the Pierce Cell Surface Protein Isolation kit. Then, biotinylated proteins were isolated with streptavidin pulldown and subjected to immunoblotting using anti-FLAG antibody. ( C ) The surface to total ratio of 4MT and N73Q/N155Q mutant was calculated and normalized to that of WT. The data represent the average of three independent experiments ± SD. *** p < 0.001. ( D ) Membrane targeting of double mutants commonly containing N155Q. Cells were immunostained using anti-FLAG antibody under non-permeabilized conditions. Images were acquired using the Zeiss LSM 880 confocal microscope. Scale bar = 50 μm.

Journal: Cells

Article Title: The Role of N -Glycosylation in the Intracellular Trafficking and Functionality of Neuronal Growth Regulator 1

doi: 10.3390/cells11071242

Figure Lengend Snippet: Membrane targeting of NEGR1 N -glycosylation mutants. ( A ) Immunofluorescence microscopy analysis of NEGR1 mutants. After transfection, HeLa cells were immunostained with anti-FLAG antibody with or without 0.1% Triton X-100. After incubation with Cy3-conjugated secondary antibody, images were captured using the Olympus BX51 fluorescence microscope. Scale bar = 50 μm. Cell surface expression was determined by calculating the relative fluorescence intensities in non-permeabilized cells after normalization to those in permeabilized cells. **** p < 0.0001. Error bars represent standard deviations (SD). ( B ) After transfection, HeLa cells were labeled with sulfo-NHS-SS-biotin using the Pierce Cell Surface Protein Isolation kit. Then, biotinylated proteins were isolated with streptavidin pulldown and subjected to immunoblotting using anti-FLAG antibody. ( C ) The surface to total ratio of 4MT and N73Q/N155Q mutant was calculated and normalized to that of WT. The data represent the average of three independent experiments ± SD. *** p < 0.001. ( D ) Membrane targeting of double mutants commonly containing N155Q. Cells were immunostained using anti-FLAG antibody under non-permeabilized conditions. Images were acquired using the Zeiss LSM 880 confocal microscope. Scale bar = 50 μm.

Article Snippet: The following antibodies were used: FLAG (mouse monoclonal or rabbit monoclonal) from Sigma-Aldrich; NEGR1, HA, and β -actin from Santa Cruz Biotechnology Inc. (Dallas, TX, USA); Cy3 anti-mouse and Alexa Fluor 594 anti-human IgG from Jackson ImmunoResearch Laboratories (West Grove, PA, USA); and Fluorescein isothiocyanate (FITC) anti-mouse IgG from Invitrogen.

Techniques: Membrane, Glycoproteomics, Immunofluorescence, Microscopy, Transfection, Incubation, Fluorescence, Expressing, Labeling, Isolation, Western Blot, Mutagenesis

Subcellular localization of NEGR1 N -glycosylation mutants. ( A ) HeLa cells were co-transfected with FLAG-NEGR1 mutant constructs and HA-PDIA4 for 24 h. Then, cells were double-immunostained with anti-FLAG and anti-HA antibodies, followed by Cy3 anti-rabbit and fluorescein isothiocyanate anti-mouse secondary antibodies. Images were captured using the Olympus BX51 fluorescence microscope. Scale bar = 50μm. ( B ) Schematic representation of the N73Q/N155Q mutant.

Journal: Cells

Article Title: The Role of N -Glycosylation in the Intracellular Trafficking and Functionality of Neuronal Growth Regulator 1

doi: 10.3390/cells11071242

Figure Lengend Snippet: Subcellular localization of NEGR1 N -glycosylation mutants. ( A ) HeLa cells were co-transfected with FLAG-NEGR1 mutant constructs and HA-PDIA4 for 24 h. Then, cells were double-immunostained with anti-FLAG and anti-HA antibodies, followed by Cy3 anti-rabbit and fluorescein isothiocyanate anti-mouse secondary antibodies. Images were captured using the Olympus BX51 fluorescence microscope. Scale bar = 50μm. ( B ) Schematic representation of the N73Q/N155Q mutant.

Article Snippet: The following antibodies were used: FLAG (mouse monoclonal or rabbit monoclonal) from Sigma-Aldrich; NEGR1, HA, and β -actin from Santa Cruz Biotechnology Inc. (Dallas, TX, USA); Cy3 anti-mouse and Alexa Fluor 594 anti-human IgG from Jackson ImmunoResearch Laboratories (West Grove, PA, USA); and Fluorescein isothiocyanate (FITC) anti-mouse IgG from Invitrogen.

Techniques: Glycoproteomics, Transfection, Mutagenesis, Construct, Fluorescence, Microscopy

Multimer formation and protein stability of NEGR1 mutants. ( A ) Non-reducing SDS-PAGE analysis. The 293T cell lysates expressing NEGR1 mutant proteins were subjected to SDS-PAGE under non-reducing conditions, followed by immunoblotting using anti-FLAG antibody. ( B ) Non-reducing SDS-PAGE using SKOV3 stable cells expressing WT or 6MT. ( C ) To determine the half-lives of NEGR1 WT and 6MT, 293T cells were incubated in the presence of cycloheximide (CHX, 50 μg/mL) after transfection. Intensities of bands were quantified by ImageJ and normalized to β -actin. Data are means ± standard deviation ( n = 3). ( D ) Half-life determination using SKOV3 cells stably expressing NEGR1 WT or 6MT. ( E ) After 293T cells were transfected with N73Q/N155Q and 2MT for 24 h, cells were incubated with 50 μg/mL CHX.

Journal: Cells

Article Title: The Role of N -Glycosylation in the Intracellular Trafficking and Functionality of Neuronal Growth Regulator 1

doi: 10.3390/cells11071242

Figure Lengend Snippet: Multimer formation and protein stability of NEGR1 mutants. ( A ) Non-reducing SDS-PAGE analysis. The 293T cell lysates expressing NEGR1 mutant proteins were subjected to SDS-PAGE under non-reducing conditions, followed by immunoblotting using anti-FLAG antibody. ( B ) Non-reducing SDS-PAGE using SKOV3 stable cells expressing WT or 6MT. ( C ) To determine the half-lives of NEGR1 WT and 6MT, 293T cells were incubated in the presence of cycloheximide (CHX, 50 μg/mL) after transfection. Intensities of bands were quantified by ImageJ and normalized to β -actin. Data are means ± standard deviation ( n = 3). ( D ) Half-life determination using SKOV3 cells stably expressing NEGR1 WT or 6MT. ( E ) After 293T cells were transfected with N73Q/N155Q and 2MT for 24 h, cells were incubated with 50 μg/mL CHX.

Article Snippet: The following antibodies were used: FLAG (mouse monoclonal or rabbit monoclonal) from Sigma-Aldrich; NEGR1, HA, and β -actin from Santa Cruz Biotechnology Inc. (Dallas, TX, USA); Cy3 anti-mouse and Alexa Fluor 594 anti-human IgG from Jackson ImmunoResearch Laboratories (West Grove, PA, USA); and Fluorescein isothiocyanate (FITC) anti-mouse IgG from Invitrogen.

Techniques: SDS Page, Expressing, Mutagenesis, Western Blot, Incubation, Transfection, Standard Deviation, Stable Transfection

Homophilic binding activities of NEGR1 mutants. ( A ) In situ homophilic interaction using soluble NEGR1 protein. After SKOV3 cells were transfected with NEGR1 WT and mutants for 24 h, cells were incubated in a serum-free medium containing purified hFc or NEGR1-hFc (30 μg/mL) for 1 h at 4 °C. After fixation, bound NEGR1-hFc was visualized by incubation with Alexa Fluor 595 anti-hFc antibody (1:50) for 1 h. To verify the protein expression, cells were separately immunostained with anti-FLAG antibody under cell permeabilization conditions. Images were obtained using the Zeiss LSM 880 confocal microscope. ( B ) Homophilic interaction was determined by calculating the relative fluorescence intensities of cells stained with anti-hFc antibody after normalization to those with anti-FLAG antibody. Data are means ± standard deviation *** p < 0.001 ( C ) Double mutants commonly containing N307Q were generated, and an in-situ binding assay was performed using NEGR1-hFc.

Journal: Cells

Article Title: The Role of N -Glycosylation in the Intracellular Trafficking and Functionality of Neuronal Growth Regulator 1

doi: 10.3390/cells11071242

Figure Lengend Snippet: Homophilic binding activities of NEGR1 mutants. ( A ) In situ homophilic interaction using soluble NEGR1 protein. After SKOV3 cells were transfected with NEGR1 WT and mutants for 24 h, cells were incubated in a serum-free medium containing purified hFc or NEGR1-hFc (30 μg/mL) for 1 h at 4 °C. After fixation, bound NEGR1-hFc was visualized by incubation with Alexa Fluor 595 anti-hFc antibody (1:50) for 1 h. To verify the protein expression, cells were separately immunostained with anti-FLAG antibody under cell permeabilization conditions. Images were obtained using the Zeiss LSM 880 confocal microscope. ( B ) Homophilic interaction was determined by calculating the relative fluorescence intensities of cells stained with anti-hFc antibody after normalization to those with anti-FLAG antibody. Data are means ± standard deviation *** p < 0.001 ( C ) Double mutants commonly containing N307Q were generated, and an in-situ binding assay was performed using NEGR1-hFc.

Article Snippet: The following antibodies were used: FLAG (mouse monoclonal or rabbit monoclonal) from Sigma-Aldrich; NEGR1, HA, and β -actin from Santa Cruz Biotechnology Inc. (Dallas, TX, USA); Cy3 anti-mouse and Alexa Fluor 594 anti-human IgG from Jackson ImmunoResearch Laboratories (West Grove, PA, USA); and Fluorescein isothiocyanate (FITC) anti-mouse IgG from Invitrogen.

Techniques: Binding Assay, In Situ, Transfection, Incubation, Purification, Expressing, Microscopy, Fluorescence, Staining, Standard Deviation, Generated

Hanging drop assay and lipid raft fractionation. ( A ) SKOV3 cell suspensions (3 × 10 4 in 30 μL culture medium) were placed as hanging drops on the lid of a Petri dish and allowed to aggregate for 16 h. Cell aggregates containing more than ten cells were counted under the microscope using ImageJ software. Data are means ± standard deviation of three independent experiments. *** p < 0.001. Scale bar = 500 μm. ( B ) After 293T cells were transfected with WT, 6MT, or a truncated Δ GPI NEGR1, lipid raft fractionation was conducted using ultracentrifugation with OptiPrep. As a raft marker, ganglioside GM1 was also visualized using horseradish peroxidase-conjugated cholera toxin B.

Journal: Cells

Article Title: The Role of N -Glycosylation in the Intracellular Trafficking and Functionality of Neuronal Growth Regulator 1

doi: 10.3390/cells11071242

Figure Lengend Snippet: Hanging drop assay and lipid raft fractionation. ( A ) SKOV3 cell suspensions (3 × 10 4 in 30 μL culture medium) were placed as hanging drops on the lid of a Petri dish and allowed to aggregate for 16 h. Cell aggregates containing more than ten cells were counted under the microscope using ImageJ software. Data are means ± standard deviation of three independent experiments. *** p < 0.001. Scale bar = 500 μm. ( B ) After 293T cells were transfected with WT, 6MT, or a truncated Δ GPI NEGR1, lipid raft fractionation was conducted using ultracentrifugation with OptiPrep. As a raft marker, ganglioside GM1 was also visualized using horseradish peroxidase-conjugated cholera toxin B.

Article Snippet: The following antibodies were used: FLAG (mouse monoclonal or rabbit monoclonal) from Sigma-Aldrich; NEGR1, HA, and β -actin from Santa Cruz Biotechnology Inc. (Dallas, TX, USA); Cy3 anti-mouse and Alexa Fluor 594 anti-human IgG from Jackson ImmunoResearch Laboratories (West Grove, PA, USA); and Fluorescein isothiocyanate (FITC) anti-mouse IgG from Invitrogen.

Techniques: Fractionation, Microscopy, Software, Standard Deviation, Transfection, Marker

FIGURE 1 The IL-6 mRNA levels were increased in the eWAT of Negr1−/−mice (A) Quantitative RT-PCR was performed to measure the mRNA expression levels of indicated genes using total RNA isolated from the epididymal WAT (eWAT) of 11-week-old WT and Negr1−/−C57BL6 mice (n = 8). The data represent mean ± SEM. **p < 0.01, ***p < 0.001. GAPDH, glyceraldehyde 3-phosphate dehydrogenase. (B) Quantitative RT-PCR analyses using total RNA obtained from bone-marrow-derived macrophages (n = 4). *p < 0.05. (C) Immunostaining of macrophages in eWAT. The paraffin-embedded WAT tissue sections were incubated with anti-F4/80 (red) and anti-CD80 (green) antibodies. Imaging was performed using an Olympus BX51 microscope. Fluorescence intensities were determined using ImageJ software. ***p < 0.001. (D, E) After blood samples were collected from 12-week-old mice (n = 8), the levels of IL-6 (D) and sIL-6R(E) were determined using the ELISA kit. The data represent mean ± SEM. *p < 0.05.

Journal: Frontiers in molecular biosciences

Article Title: Neuronal growth regulator 1 may modulate interleukin-6 signaling in adipocytes.

doi: 10.3389/fmolb.2023.1148521

Figure Lengend Snippet: FIGURE 1 The IL-6 mRNA levels were increased in the eWAT of Negr1−/−mice (A) Quantitative RT-PCR was performed to measure the mRNA expression levels of indicated genes using total RNA isolated from the epididymal WAT (eWAT) of 11-week-old WT and Negr1−/−C57BL6 mice (n = 8). The data represent mean ± SEM. **p < 0.01, ***p < 0.001. GAPDH, glyceraldehyde 3-phosphate dehydrogenase. (B) Quantitative RT-PCR analyses using total RNA obtained from bone-marrow-derived macrophages (n = 4). *p < 0.05. (C) Immunostaining of macrophages in eWAT. The paraffin-embedded WAT tissue sections were incubated with anti-F4/80 (red) and anti-CD80 (green) antibodies. Imaging was performed using an Olympus BX51 microscope. Fluorescence intensities were determined using ImageJ software. ***p < 0.001. (D, E) After blood samples were collected from 12-week-old mice (n = 8), the levels of IL-6 (D) and sIL-6R(E) were determined using the ELISA kit. The data represent mean ± SEM. *p < 0.05.

Article Snippet: The following antibodies were used to visualize specific proteins: FLAG, MYC, and β-actin (Sigma-Aldrich, St. Louis, MO, United States); GFP, IL-6R, gp130, NEGR1, AKT1, and p-AKT1 (Santa Cruz Biotechnology, Santa Cruz, CA, United States); glyceraldehyde 3- phosphate dehydrogenase (GAPDH; Cusabio, College Park, MD, USA); STAT3, p-STAT3 (Cell Signaling Technologies, Beverley, MA, United States), and human Fc (hFc; Gibco, Thermo Fisher Scientific, Waltham, MA, United States).

Techniques: Quantitative RT-PCR, Expressing, Isolation, Derivative Assay, Immunostaining, Incubation, Imaging, Microscopy, Fluorescence, Software, Enzyme-linked Immunosorbent Assay

FIGURE 2 The protein expression levels of IL-6R components in the eWAT of Negr1−/−mice. (A) Comparison of protein levels of IL-6 signaling complex in the gonadal WAT of WT and Negr1−/−mice (n = 9). The band intensity of each protein was normalized to the vinculin level. The data represent mean ± SEM. *p < 0.05, **p < 0.01, ***p < 0.001. (B) Visualization of IL-6R in the eWAT of 13-week-old WT and Negr1−/−mice by immunostaining paraffin-embedded tissue sections using an anti-IL-6R antibody (×400 magnification). Fluorescence signals were measured using ImageJ software.

Journal: Frontiers in molecular biosciences

Article Title: Neuronal growth regulator 1 may modulate interleukin-6 signaling in adipocytes.

doi: 10.3389/fmolb.2023.1148521

Figure Lengend Snippet: FIGURE 2 The protein expression levels of IL-6R components in the eWAT of Negr1−/−mice. (A) Comparison of protein levels of IL-6 signaling complex in the gonadal WAT of WT and Negr1−/−mice (n = 9). The band intensity of each protein was normalized to the vinculin level. The data represent mean ± SEM. *p < 0.05, **p < 0.01, ***p < 0.001. (B) Visualization of IL-6R in the eWAT of 13-week-old WT and Negr1−/−mice by immunostaining paraffin-embedded tissue sections using an anti-IL-6R antibody (×400 magnification). Fluorescence signals were measured using ImageJ software.

Article Snippet: The following antibodies were used to visualize specific proteins: FLAG, MYC, and β-actin (Sigma-Aldrich, St. Louis, MO, United States); GFP, IL-6R, gp130, NEGR1, AKT1, and p-AKT1 (Santa Cruz Biotechnology, Santa Cruz, CA, United States); glyceraldehyde 3- phosphate dehydrogenase (GAPDH; Cusabio, College Park, MD, USA); STAT3, p-STAT3 (Cell Signaling Technologies, Beverley, MA, United States), and human Fc (hFc; Gibco, Thermo Fisher Scientific, Waltham, MA, United States).

Techniques: Expressing, Comparison, Immunostaining, Fluorescence, Software

FIGURE 3 Increased STAT3 activation in the eWAT of Negr1−/−mice. (A) Immunostaining of eWAT tissue sections with an anti-pSTAT3 antibody. Imaging was performed using an Olympus BX51 microscope. Fluorescence intensity was calculated using ImageJ software. *p < 0.05. (B) Primary adipocytes (n = 4) were isolated from WT and Negr1−/−mice and incubated with IL-6 (25 ng/mL) for 10 min before immunoblotting. (C) Primary adipocytes were incubated with hyper-IL-6-containing conditioned media for 10 min and pSTAT3/STAT3 levels were calculated based on the band intensities using ImageJ software. **p < 0.01.

Journal: Frontiers in molecular biosciences

Article Title: Neuronal growth regulator 1 may modulate interleukin-6 signaling in adipocytes.

doi: 10.3389/fmolb.2023.1148521

Figure Lengend Snippet: FIGURE 3 Increased STAT3 activation in the eWAT of Negr1−/−mice. (A) Immunostaining of eWAT tissue sections with an anti-pSTAT3 antibody. Imaging was performed using an Olympus BX51 microscope. Fluorescence intensity was calculated using ImageJ software. *p < 0.05. (B) Primary adipocytes (n = 4) were isolated from WT and Negr1−/−mice and incubated with IL-6 (25 ng/mL) for 10 min before immunoblotting. (C) Primary adipocytes were incubated with hyper-IL-6-containing conditioned media for 10 min and pSTAT3/STAT3 levels were calculated based on the band intensities using ImageJ software. **p < 0.01.

Article Snippet: The following antibodies were used to visualize specific proteins: FLAG, MYC, and β-actin (Sigma-Aldrich, St. Louis, MO, United States); GFP, IL-6R, gp130, NEGR1, AKT1, and p-AKT1 (Santa Cruz Biotechnology, Santa Cruz, CA, United States); glyceraldehyde 3- phosphate dehydrogenase (GAPDH; Cusabio, College Park, MD, USA); STAT3, p-STAT3 (Cell Signaling Technologies, Beverley, MA, United States), and human Fc (hFc; Gibco, Thermo Fisher Scientific, Waltham, MA, United States).

Techniques: Activation Assay, Immunostaining, Imaging, Microscopy, Fluorescence, Software, Isolation, Incubation, Western Blot

FIGURE 4 NEGR1 may interact with IL-6R. (A) Protein structure of NEGR1 and IL-6R. (B) Co-immunoprecipitation (IP) was performed using an anti-FLAG antibody after HeLa cells were co-transfected with GFP-NEGR1 and FLAG-IL-6R for 24h. Co-isolated NEGR1 was visualized with the anti-GFP antibody. (C) Reciprocal co-IP between GFP-NEGR1 and FLAG-IL-6R using anti-GFP antibody. (D) Co-IP between the endogenous proteins. After HeLa cell lysates were subjected to IP with an anti-NEGR1 antibody, IL-6R was visualized with IL-6R antibody. (E, F) In situ proximity ligation assay of SKOV-3-FLAG- NEGR1 stable cells under permeabilized (E) or non-permeabilized (F) conditions. For cell permeabilization, cells were treated with 0.1% Triton X-100 for 10 min. Then, cells were incubated with rabbit anti-FLAG antibody and mouse anti-IL-6R antibody for 1 h, followed by treatment of PLA probes (anti- mouse MINUS and anti-rabbit PLUS). The bar represents 50 μm.

Journal: Frontiers in molecular biosciences

Article Title: Neuronal growth regulator 1 may modulate interleukin-6 signaling in adipocytes.

doi: 10.3389/fmolb.2023.1148521

Figure Lengend Snippet: FIGURE 4 NEGR1 may interact with IL-6R. (A) Protein structure of NEGR1 and IL-6R. (B) Co-immunoprecipitation (IP) was performed using an anti-FLAG antibody after HeLa cells were co-transfected with GFP-NEGR1 and FLAG-IL-6R for 24h. Co-isolated NEGR1 was visualized with the anti-GFP antibody. (C) Reciprocal co-IP between GFP-NEGR1 and FLAG-IL-6R using anti-GFP antibody. (D) Co-IP between the endogenous proteins. After HeLa cell lysates were subjected to IP with an anti-NEGR1 antibody, IL-6R was visualized with IL-6R antibody. (E, F) In situ proximity ligation assay of SKOV-3-FLAG- NEGR1 stable cells under permeabilized (E) or non-permeabilized (F) conditions. For cell permeabilization, cells were treated with 0.1% Triton X-100 for 10 min. Then, cells were incubated with rabbit anti-FLAG antibody and mouse anti-IL-6R antibody for 1 h, followed by treatment of PLA probes (anti- mouse MINUS and anti-rabbit PLUS). The bar represents 50 μm.

Article Snippet: The following antibodies were used to visualize specific proteins: FLAG, MYC, and β-actin (Sigma-Aldrich, St. Louis, MO, United States); GFP, IL-6R, gp130, NEGR1, AKT1, and p-AKT1 (Santa Cruz Biotechnology, Santa Cruz, CA, United States); glyceraldehyde 3- phosphate dehydrogenase (GAPDH; Cusabio, College Park, MD, USA); STAT3, p-STAT3 (Cell Signaling Technologies, Beverley, MA, United States), and human Fc (hFc; Gibco, Thermo Fisher Scientific, Waltham, MA, United States).

Techniques: Immunoprecipitation, Transfection, Isolation, Co-Immunoprecipitation Assay, In Situ, Proximity Ligation Assay, Incubation

FIGURE 5 Domain mapping of the interaction between NEGR1 and IL-6R. (A) Domain structure of NEGR1 and IL-6R. (B) Interaction between GST-fused IL-6R extracellular domain (ECD, 20–357) and FLAG-tagged soluble NEGR1 (34–323) was examined by GST-pulldown. (C) Various IL-6R deletion constructs were generated and GST-pulldown was performed after 293T cells were transfected with IL-6R deletion mutants together with FLAG-NEGR1 (34–323). CBM, cytokine binding module; D1 ~ D3, domain 1–3; TM, transmembrane domain; CD, cytoplasmic domain. (D) Determination of NEGR1 domain required for IL-6R interaction. GST-pulldown was carried out after 293T cells were co-transfected with NEGR1 domain mutants and FLAG-IL-6R (20–357). C1 ~ C3, C2-type immunoglobulin domain 1–3.

Journal: Frontiers in molecular biosciences

Article Title: Neuronal growth regulator 1 may modulate interleukin-6 signaling in adipocytes.

doi: 10.3389/fmolb.2023.1148521

Figure Lengend Snippet: FIGURE 5 Domain mapping of the interaction between NEGR1 and IL-6R. (A) Domain structure of NEGR1 and IL-6R. (B) Interaction between GST-fused IL-6R extracellular domain (ECD, 20–357) and FLAG-tagged soluble NEGR1 (34–323) was examined by GST-pulldown. (C) Various IL-6R deletion constructs were generated and GST-pulldown was performed after 293T cells were transfected with IL-6R deletion mutants together with FLAG-NEGR1 (34–323). CBM, cytokine binding module; D1 ~ D3, domain 1–3; TM, transmembrane domain; CD, cytoplasmic domain. (D) Determination of NEGR1 domain required for IL-6R interaction. GST-pulldown was carried out after 293T cells were co-transfected with NEGR1 domain mutants and FLAG-IL-6R (20–357). C1 ~ C3, C2-type immunoglobulin domain 1–3.

Article Snippet: The following antibodies were used to visualize specific proteins: FLAG, MYC, and β-actin (Sigma-Aldrich, St. Louis, MO, United States); GFP, IL-6R, gp130, NEGR1, AKT1, and p-AKT1 (Santa Cruz Biotechnology, Santa Cruz, CA, United States); glyceraldehyde 3- phosphate dehydrogenase (GAPDH; Cusabio, College Park, MD, USA); STAT3, p-STAT3 (Cell Signaling Technologies, Beverley, MA, United States), and human Fc (hFc; Gibco, Thermo Fisher Scientific, Waltham, MA, United States).

Techniques: Construct, Generated, Transfection, Binding Assay

FIGURE 6 Co-localization analysis of NEGR1 and IL-6R. (A) Gel filtration chromatography was performed with the Sephacryl S-400 HR column using SKOV-3- NEGR1-FLAG cells. Eluents were used for immunoblotting with anti-FLAG and anti-IL-6R antibodies. (B) Lipid raft fractionation using OptiPrep™ Gradient. Centrifugation was performed at 76,000 × g for 18 h at 4°C after 293T cells were transfected with FLAG-IL-6R together with GFP-NEGR1 (right) or GFP control (left). Frotillin-1 was used as a lipid raft marker. (C) Co-localization of NEGR1 and IL-6R in 3T3-L1-FLAG-NEGR1 stable cells. After cell permeabilization, cells were incubated with anti-FLAG (blue) and anti-IL-6R (red) antibodies. Cholera toxin subunit B (CTB) was used to visualize lipid rafts (green). Imaging was performed using a confocal laser scanning microscope Zeiss LSM 880 (Zeiss, Germany). The scale bar represents 50 μm. (D) Confocal microscopy of N2a cells after transfection of FLAG-NEGR1 plasmids. Cells were incubated using anti-FLAG (green) and anti-IL-6R (red) antibodies, and cell nuclei were stained with DAPI. The scale bar represents 50 μm.

Journal: Frontiers in molecular biosciences

Article Title: Neuronal growth regulator 1 may modulate interleukin-6 signaling in adipocytes.

doi: 10.3389/fmolb.2023.1148521

Figure Lengend Snippet: FIGURE 6 Co-localization analysis of NEGR1 and IL-6R. (A) Gel filtration chromatography was performed with the Sephacryl S-400 HR column using SKOV-3- NEGR1-FLAG cells. Eluents were used for immunoblotting with anti-FLAG and anti-IL-6R antibodies. (B) Lipid raft fractionation using OptiPrep™ Gradient. Centrifugation was performed at 76,000 × g for 18 h at 4°C after 293T cells were transfected with FLAG-IL-6R together with GFP-NEGR1 (right) or GFP control (left). Frotillin-1 was used as a lipid raft marker. (C) Co-localization of NEGR1 and IL-6R in 3T3-L1-FLAG-NEGR1 stable cells. After cell permeabilization, cells were incubated with anti-FLAG (blue) and anti-IL-6R (red) antibodies. Cholera toxin subunit B (CTB) was used to visualize lipid rafts (green). Imaging was performed using a confocal laser scanning microscope Zeiss LSM 880 (Zeiss, Germany). The scale bar represents 50 μm. (D) Confocal microscopy of N2a cells after transfection of FLAG-NEGR1 plasmids. Cells were incubated using anti-FLAG (green) and anti-IL-6R (red) antibodies, and cell nuclei were stained with DAPI. The scale bar represents 50 μm.

Article Snippet: The following antibodies were used to visualize specific proteins: FLAG, MYC, and β-actin (Sigma-Aldrich, St. Louis, MO, United States); GFP, IL-6R, gp130, NEGR1, AKT1, and p-AKT1 (Santa Cruz Biotechnology, Santa Cruz, CA, United States); glyceraldehyde 3- phosphate dehydrogenase (GAPDH; Cusabio, College Park, MD, USA); STAT3, p-STAT3 (Cell Signaling Technologies, Beverley, MA, United States), and human Fc (hFc; Gibco, Thermo Fisher Scientific, Waltham, MA, United States).

Techniques: Chromatography, Western Blot, Fractionation, Gradient Centrifugation, Transfection, Control, Marker, Incubation, Imaging, Laser-Scanning Microscopy, Confocal Microscopy, Staining

FIGURE 7 NEGR1 may attenuate IL-6 trans-signaling. (A) Hyper-IL-6-containing conditioned medium was obtained after transfection of HeLa cells with pcDNA3-hyper-IL-6-MYC for 24h. (B) After transfection with GFP-NEGR1, HeLa cells were incubated with Hyper-IL-6-containing medium for 10 min. Then, cells were lysed and used for immunoblotting with indicated antibodies. Band density was calculated using ImageJ software. (C) After HeLa cells were transfected with increasing amounts of GFP-NEGR1 plasmids, the cell lysates were mixed with the hyper-IL-6-containing conditioned medium. Then, IP was performed using an anti-gp130 antibody, and the co-isolated hyper-IL-6 was detected with an anti-MYC antibody. (D) Comparison of binding of Hyper-IL-6-MYC on the cell surface. After SKOV-3 (upper panels) and SKOV-3-FLAG-NEGR1 stable cells (lower panels) were incubated with hyper-IL-6 containing conditional medium 1h, cell surface-bound hyper-IL-6 protein was visualized using anti-MYC. Imaging was performed using an Olympus BX51 microscope (Tokyo, Japan). Integrated fluorescence intensity was quantified using ImageJ software. *p < 0.05. Scale bar = 50 mm.

Journal: Frontiers in molecular biosciences

Article Title: Neuronal growth regulator 1 may modulate interleukin-6 signaling in adipocytes.

doi: 10.3389/fmolb.2023.1148521

Figure Lengend Snippet: FIGURE 7 NEGR1 may attenuate IL-6 trans-signaling. (A) Hyper-IL-6-containing conditioned medium was obtained after transfection of HeLa cells with pcDNA3-hyper-IL-6-MYC for 24h. (B) After transfection with GFP-NEGR1, HeLa cells were incubated with Hyper-IL-6-containing medium for 10 min. Then, cells were lysed and used for immunoblotting with indicated antibodies. Band density was calculated using ImageJ software. (C) After HeLa cells were transfected with increasing amounts of GFP-NEGR1 plasmids, the cell lysates were mixed with the hyper-IL-6-containing conditioned medium. Then, IP was performed using an anti-gp130 antibody, and the co-isolated hyper-IL-6 was detected with an anti-MYC antibody. (D) Comparison of binding of Hyper-IL-6-MYC on the cell surface. After SKOV-3 (upper panels) and SKOV-3-FLAG-NEGR1 stable cells (lower panels) were incubated with hyper-IL-6 containing conditional medium 1h, cell surface-bound hyper-IL-6 protein was visualized using anti-MYC. Imaging was performed using an Olympus BX51 microscope (Tokyo, Japan). Integrated fluorescence intensity was quantified using ImageJ software. *p < 0.05. Scale bar = 50 mm.

Article Snippet: The following antibodies were used to visualize specific proteins: FLAG, MYC, and β-actin (Sigma-Aldrich, St. Louis, MO, United States); GFP, IL-6R, gp130, NEGR1, AKT1, and p-AKT1 (Santa Cruz Biotechnology, Santa Cruz, CA, United States); glyceraldehyde 3- phosphate dehydrogenase (GAPDH; Cusabio, College Park, MD, USA); STAT3, p-STAT3 (Cell Signaling Technologies, Beverley, MA, United States), and human Fc (hFc; Gibco, Thermo Fisher Scientific, Waltham, MA, United States).

Techniques: Transfection, Incubation, Western Blot, Software, Isolation, Comparison, Binding Assay, Imaging, Microscopy

FIGURE 8 Proposed role of NEGR1 in IL-6 signaling.

Journal: Frontiers in molecular biosciences

Article Title: Neuronal growth regulator 1 may modulate interleukin-6 signaling in adipocytes.

doi: 10.3389/fmolb.2023.1148521

Figure Lengend Snippet: FIGURE 8 Proposed role of NEGR1 in IL-6 signaling.

Article Snippet: The following antibodies were used to visualize specific proteins: FLAG, MYC, and β-actin (Sigma-Aldrich, St. Louis, MO, United States); GFP, IL-6R, gp130, NEGR1, AKT1, and p-AKT1 (Santa Cruz Biotechnology, Santa Cruz, CA, United States); glyceraldehyde 3- phosphate dehydrogenase (GAPDH; Cusabio, College Park, MD, USA); STAT3, p-STAT3 (Cell Signaling Technologies, Beverley, MA, United States), and human Fc (hFc; Gibco, Thermo Fisher Scientific, Waltham, MA, United States).

Techniques:

Primer and probes

Journal: Cardiovascular Diabetology

Article Title: Expression of fourteen novel obesity-related genes in zucker diabetic fatty rats

doi: 10.1186/1475-2840-11-48

Figure Lengend Snippet: Primer and probes

Article Snippet: NEGR1 , Neuronal growth regulator 1 , Rn00572380_m1.

Techniques: Derivative Assay, Variant Assay

Expression of genes with a known neuronal expression. a) Relative expression of TMEM18. * p < 0.05 vs. ZL KF, ZL SF and ZL MF; † p < 0.05 vs. ZDF KF, ZDF SF and ZDF MF. b) Relative expression of KCTD15. * p < 0.05 vs. ZL KF and ZL SF; † p < 0.05 vs. ZDF KF and ZDF SF. c) Relative expression of NEGR1. * p < 0.05 vs. ZL KF, ZL SF and ZL MF; † p < 0.05 vs. ZDF KF, ZDF SF and ZDF MF; # p < 0.05 vs. ZDF KF; ¶ p < 0.05 vs. ZDF SF; ‡ p < 0.05 vs. ZDF MF. d) Relative expression of NRXN3. No detectable mRNA-amount in adipose tissues.

Journal: Cardiovascular Diabetology

Article Title: Expression of fourteen novel obesity-related genes in zucker diabetic fatty rats

doi: 10.1186/1475-2840-11-48

Figure Lengend Snippet: Expression of genes with a known neuronal expression. a) Relative expression of TMEM18. * p < 0.05 vs. ZL KF, ZL SF and ZL MF; † p < 0.05 vs. ZDF KF, ZDF SF and ZDF MF. b) Relative expression of KCTD15. * p < 0.05 vs. ZL KF and ZL SF; † p < 0.05 vs. ZDF KF and ZDF SF. c) Relative expression of NEGR1. * p < 0.05 vs. ZL KF, ZL SF and ZL MF; † p < 0.05 vs. ZDF KF, ZDF SF and ZDF MF; # p < 0.05 vs. ZDF KF; ¶ p < 0.05 vs. ZDF SF; ‡ p < 0.05 vs. ZDF MF. d) Relative expression of NRXN3. No detectable mRNA-amount in adipose tissues.

Article Snippet: NEGR1 , Neuronal growth regulator 1 , Rn00572380_m1.

Techniques: Expressing

Differentially expressed genes and Kyoto Encyclopedia of Genes and Genomes analysis. Volcano plots showing the top twenty up- or downregulated genes for each cell type. The red dots represent upregulated genes, and the blue dots represent downregulated genes. ( P value < 0.05, and |log2foldchange| > 0.58). Bubble plot indicating the top enriched pathways for each cell type based on KEGGpathway enrichment analysis of differentially expressed genes( www.kegg.jp/kegg/kegg1.html ). The sizes of the dots represent the number of genes included in each pathway. The colour gradient of dots represents the adjusted P values of each enriched pathway. The genes Pfkfb3 , Tbc1d1 and the insulin signaling pathway; Pdgfd and the PI3K-Akt signaling pathway; Cxcr2 and PLD, Rap1 signaling pathways; Ccl21 and chemical carcinogenesis-reactive oxygen species signaling pathway; Mef2c and the calcium signaling pathway; Negr1 and leukocyte transendothelial migration signaling pathway are labelled by the black and red bars in Panels a , b , c , d , e , and f .

Journal: Scientific Reports

Article Title: Single-nucleus transcriptomic profiling of the diaphragm during mechanical ventilation

doi: 10.1038/s41598-024-82530-4

Figure Lengend Snippet: Differentially expressed genes and Kyoto Encyclopedia of Genes and Genomes analysis. Volcano plots showing the top twenty up- or downregulated genes for each cell type. The red dots represent upregulated genes, and the blue dots represent downregulated genes. ( P value < 0.05, and |log2foldchange| > 0.58). Bubble plot indicating the top enriched pathways for each cell type based on KEGGpathway enrichment analysis of differentially expressed genes( www.kegg.jp/kegg/kegg1.html ). The sizes of the dots represent the number of genes included in each pathway. The colour gradient of dots represents the adjusted P values of each enriched pathway. The genes Pfkfb3 , Tbc1d1 and the insulin signaling pathway; Pdgfd and the PI3K-Akt signaling pathway; Cxcr2 and PLD, Rap1 signaling pathways; Ccl21 and chemical carcinogenesis-reactive oxygen species signaling pathway; Mef2c and the calcium signaling pathway; Negr1 and leukocyte transendothelial migration signaling pathway are labelled by the black and red bars in Panels a , b , c , d , e , and f .

Article Snippet: After the semidry blotting procedure (50 min, 90 V), the membrane was incubated for 1 h at room temperature (RT) in 5% BSA blocking solution, followed by overnight incubation on a shaker at 4 °C with primary antibodies against PFKFB3 (bs-3528R, Boster Biological Technology Co., Ltd., Wuhan, China), PDGFD (bs-24572R, Boster), CXCR2 (bs-1629R, Boster), NEGR1 (bs-11095R, Boster), SEMA3A (bs-10468R, Boster), MEF2C (bs-4130R, Boster) and β-actin (66009-1-Ig, Proteintech, Wuhan, China) as a loading control.

Techniques: Protein-Protein interactions, Migration

Protein-protein interaction network (PPI network).We constructed nine PPI networks displaying protein-protein interactions among the related genes. The nodes represent proteins, and the edges represent the interaction strength between two proteins. The proteins PFKFB3 ( a ), PDGFD ( b ), CXCR2 ( c ), CCL21 ( d ), SEMA3A ( e ), RYR3 ( f ), MEF2C ( g ), NEGR1( h ) and TBC1D1 ( i ) which are located at the hub of the interaction network, are responsible for diaphragm fibrosis and atrophy.

Journal: Scientific Reports

Article Title: Single-nucleus transcriptomic profiling of the diaphragm during mechanical ventilation

doi: 10.1038/s41598-024-82530-4

Figure Lengend Snippet: Protein-protein interaction network (PPI network).We constructed nine PPI networks displaying protein-protein interactions among the related genes. The nodes represent proteins, and the edges represent the interaction strength between two proteins. The proteins PFKFB3 ( a ), PDGFD ( b ), CXCR2 ( c ), CCL21 ( d ), SEMA3A ( e ), RYR3 ( f ), MEF2C ( g ), NEGR1( h ) and TBC1D1 ( i ) which are located at the hub of the interaction network, are responsible for diaphragm fibrosis and atrophy.

Article Snippet: After the semidry blotting procedure (50 min, 90 V), the membrane was incubated for 1 h at room temperature (RT) in 5% BSA blocking solution, followed by overnight incubation on a shaker at 4 °C with primary antibodies against PFKFB3 (bs-3528R, Boster Biological Technology Co., Ltd., Wuhan, China), PDGFD (bs-24572R, Boster), CXCR2 (bs-1629R, Boster), NEGR1 (bs-11095R, Boster), SEMA3A (bs-10468R, Boster), MEF2C (bs-4130R, Boster) and β-actin (66009-1-Ig, Proteintech, Wuhan, China) as a loading control.

Techniques: Construct, Protein-Protein interactions

Quantitative real-time polymerase chain reaction (qRT-PCR) and Western blotting. qRT-PCR and Western blotting showing the expression of selected genes and corresponding proteins in the mechanically ventilated diaphragm and control ones. The bar graphs show the quantification of the mRNA expression of Pfkfb3 ( a ), Pdgfd ( b ), Cxcr2 ( c ), Negr1 ( d ), Sema3a ( e ), and Mef2c ( f ) normalized to that of GAPDH. Asterisks indicate significant differences ( n = 3 in each group) (* P < 0.05). Western blotting analysis of the protein expression of PFKFB3 ( g ), PDGFD ( h ), CXCR2 ( i ), NEGR1 ( j ), SEMA3A ( k ), and MEF2C ( l ) normalized to that of β-actin as a loading control.

Journal: Scientific Reports

Article Title: Single-nucleus transcriptomic profiling of the diaphragm during mechanical ventilation

doi: 10.1038/s41598-024-82530-4

Figure Lengend Snippet: Quantitative real-time polymerase chain reaction (qRT-PCR) and Western blotting. qRT-PCR and Western blotting showing the expression of selected genes and corresponding proteins in the mechanically ventilated diaphragm and control ones. The bar graphs show the quantification of the mRNA expression of Pfkfb3 ( a ), Pdgfd ( b ), Cxcr2 ( c ), Negr1 ( d ), Sema3a ( e ), and Mef2c ( f ) normalized to that of GAPDH. Asterisks indicate significant differences ( n = 3 in each group) (* P < 0.05). Western blotting analysis of the protein expression of PFKFB3 ( g ), PDGFD ( h ), CXCR2 ( i ), NEGR1 ( j ), SEMA3A ( k ), and MEF2C ( l ) normalized to that of β-actin as a loading control.

Article Snippet: After the semidry blotting procedure (50 min, 90 V), the membrane was incubated for 1 h at room temperature (RT) in 5% BSA blocking solution, followed by overnight incubation on a shaker at 4 °C with primary antibodies against PFKFB3 (bs-3528R, Boster Biological Technology Co., Ltd., Wuhan, China), PDGFD (bs-24572R, Boster), CXCR2 (bs-1629R, Boster), NEGR1 (bs-11095R, Boster), SEMA3A (bs-10468R, Boster), MEF2C (bs-4130R, Boster) and β-actin (66009-1-Ig, Proteintech, Wuhan, China) as a loading control.

Techniques: Real-time Polymerase Chain Reaction, Quantitative RT-PCR, Western Blot, Expressing, Control

Copy number variants selected in five genes and four intergenic regions.

Journal: BioMed Research International

Article Title: Copy Number Variations in Candidate Genes and Intergenic Regions Affect Body Mass Index and Abdominal Obesity in Mexican Children

doi: 10.1155/2017/2432957

Figure Lengend Snippet: Copy number variants selected in five genes and four intergenic regions.

Article Snippet: Hs06530590_cn , esv3586400 , Chr1: 72516113–72546537 , NEGR1 , Intron 1 , [ ] .

Techniques:

Effect of copy number in genes and intergenic regions on body mass index and waist circumference.

Journal: BioMed Research International

Article Title: Copy Number Variations in Candidate Genes and Intergenic Regions Affect Body Mass Index and Abdominal Obesity in Mexican Children

doi: 10.1155/2017/2432957

Figure Lengend Snippet: Effect of copy number in genes and intergenic regions on body mass index and waist circumference.

Article Snippet: Hs06530590_cn , esv3586400 , Chr1: 72516113–72546537 , NEGR1 , Intron 1 , [ ] .

Techniques:

Association between the CNVs and abdominal obesity in Mexican children. The forest plot shows the results of the logistic regression models adjusted for age and gender; for the ARHGEF4 , NEGR1, and CPXCR1 and intergenic regions the reference group was defined as individuals with loss copy number (0–2) and compared with the group with the highest copy number (≥3), while for the INS the reference group was of children with the highest copy number (≥2) and compared with the group with loss copy number (0-1).

Journal: BioMed Research International

Article Title: Copy Number Variations in Candidate Genes and Intergenic Regions Affect Body Mass Index and Abdominal Obesity in Mexican Children

doi: 10.1155/2017/2432957

Figure Lengend Snippet: Association between the CNVs and abdominal obesity in Mexican children. The forest plot shows the results of the logistic regression models adjusted for age and gender; for the ARHGEF4 , NEGR1, and CPXCR1 and intergenic regions the reference group was defined as individuals with loss copy number (0–2) and compared with the group with the highest copy number (≥3), while for the INS the reference group was of children with the highest copy number (≥2) and compared with the group with loss copy number (0-1).

Article Snippet: Hs06530590_cn , esv3586400 , Chr1: 72516113–72546537 , NEGR1 , Intron 1 , [ ] .

Techniques:

Prediction of NEGR1 downstream pathway and its impact on the tumor immune microenvironment. A Results of KEGG enrichment analysis and GO (including Biological process, Cellular component, and Molecular function) enrichment analysis of common differential genes; B Results of GSEA enrichment analysis of the two mRNA datasets; C TIMER database analysis of the relationship between differential expression of NEGR1 and macrophage polarization

Journal: Journal of Translational Medicine

Article Title: miR-122/NEGR1 axis contributes colorectal cancer liver metastasis by PI3K/AKT pathway and macrophage modulation

doi: 10.1186/s12967-024-05901-5

Figure Lengend Snippet: Prediction of NEGR1 downstream pathway and its impact on the tumor immune microenvironment. A Results of KEGG enrichment analysis and GO (including Biological process, Cellular component, and Molecular function) enrichment analysis of common differential genes; B Results of GSEA enrichment analysis of the two mRNA datasets; C TIMER database analysis of the relationship between differential expression of NEGR1 and macrophage polarization

Article Snippet: The cells were cultured in a DMEM (Keygen Biotech, China) high-glucose medium containing 10% fetal bovine serum (FBS) (Procell, China) and incubated in a constant temperature incubator at 37 °C with 5% CO 2 . miR-122 mimic or pc- NEGR1 (Genechem, China) was transfected into the MC38 cell line using Lipofectamine 2000 reagent following the manufacturer’s instructions(Thermo, USA).

Techniques: Quantitative Proteomics

Expression levels of NEGR1 and miR-122 in liver metastatic tissues of colorectal cancer and patients’ blood. A Results of pan-cancer analysis of NEGR1 in different cancer types with their paracancerous tissues by TIMER database; B qRT-PCR to detect the expression levels of NEGR1 in liver metastases, primary tumor, and paracancerous normal tissues of colorectal cancer patients; C qRT-PCR to detect the expression levels of miR-122 in liver metastases, primary tumor, and paracancerous normal tissues of colorectal cancer patients; D ELISA was performed to detect the expression level of NEGR1 in liver metastases, primary tumor, and normal tissues adjacent to cancer in colorectal cancer patients; E ELISA was performed to detect the expression level of NEGR1 in the blood of normal subjects, colon cancer patients without metastases, and colon cancer patients with liver metastases. ns p ≥ 0.05, *p < 0.05, **p < 0.01, ***p < 0.001, ****p < 0.0001

Journal: Journal of Translational Medicine

Article Title: miR-122/NEGR1 axis contributes colorectal cancer liver metastasis by PI3K/AKT pathway and macrophage modulation

doi: 10.1186/s12967-024-05901-5

Figure Lengend Snippet: Expression levels of NEGR1 and miR-122 in liver metastatic tissues of colorectal cancer and patients’ blood. A Results of pan-cancer analysis of NEGR1 in different cancer types with their paracancerous tissues by TIMER database; B qRT-PCR to detect the expression levels of NEGR1 in liver metastases, primary tumor, and paracancerous normal tissues of colorectal cancer patients; C qRT-PCR to detect the expression levels of miR-122 in liver metastases, primary tumor, and paracancerous normal tissues of colorectal cancer patients; D ELISA was performed to detect the expression level of NEGR1 in liver metastases, primary tumor, and normal tissues adjacent to cancer in colorectal cancer patients; E ELISA was performed to detect the expression level of NEGR1 in the blood of normal subjects, colon cancer patients without metastases, and colon cancer patients with liver metastases. ns p ≥ 0.05, *p < 0.05, **p < 0.01, ***p < 0.001, ****p < 0.0001

Article Snippet: The cells were cultured in a DMEM (Keygen Biotech, China) high-glucose medium containing 10% fetal bovine serum (FBS) (Procell, China) and incubated in a constant temperature incubator at 37 °C with 5% CO 2 . miR-122 mimic or pc- NEGR1 (Genechem, China) was transfected into the MC38 cell line using Lipofectamine 2000 reagent following the manufacturer’s instructions(Thermo, USA).

Techniques: Expressing, Quantitative RT-PCR, Enzyme-linked Immunosorbent Assay

Effect of miR-122 targeting NEGR1 on MC38 cell function. A qRT-PCR was performed to detect the expression level of miR-122 in MC38 cells in miR-122 mimic and control groups; B Wound healing assay was conducted to analyze the migration ability of MC38 cells in miR-122 mimic and control groups at 0 h and 24 h; C Colony formation assay was carried out to evaluate the proliferation and colony formation ability of MC38 cells in miR-122 mimic and control groups; D Transwell assay was conducted to evaluate the proliferation and colony formation ability of MC38 cells in miR-122 mimic and control groups; E qRT-PCR was performed to detect the expression level of miR-122 in MC38 cells in pc- NEGR1 and control groups. F Wound healing assay was conducted to analyze the migration ability of MC38 cells in miR-122 mimic and control groups at 0 h and 24 h; G Colony formation assay to assess the proliferation and colony-forming ability of MC38 cells in miR-122 mimic and control groups; H Transwell assay to assess the invasion ability of MC38 cells in miR-122 mimic and control groups; I TargetScan to predict that NEGR1 is a potential target of miR-122; J Dual-fluorescence assay to evaluate the expression level of NEGR1 in MC38 cells in the pc- NEGR1 and control groups; K Western blot to detect NEGR1 protein expression levels in control, miR-122 mimic, pc- NEGR1 , and miR-122 mimic + pc- NEGR1 groups; L Western blot and qRT-PCR were used to detect the expression level of NEGR1 in the RNA-pulldown assay. ns p ≥ 0.05, *p < 0.05, **p < 0.01, ***p < 0.001

Journal: Journal of Translational Medicine

Article Title: miR-122/NEGR1 axis contributes colorectal cancer liver metastasis by PI3K/AKT pathway and macrophage modulation

doi: 10.1186/s12967-024-05901-5

Figure Lengend Snippet: Effect of miR-122 targeting NEGR1 on MC38 cell function. A qRT-PCR was performed to detect the expression level of miR-122 in MC38 cells in miR-122 mimic and control groups; B Wound healing assay was conducted to analyze the migration ability of MC38 cells in miR-122 mimic and control groups at 0 h and 24 h; C Colony formation assay was carried out to evaluate the proliferation and colony formation ability of MC38 cells in miR-122 mimic and control groups; D Transwell assay was conducted to evaluate the proliferation and colony formation ability of MC38 cells in miR-122 mimic and control groups; E qRT-PCR was performed to detect the expression level of miR-122 in MC38 cells in pc- NEGR1 and control groups. F Wound healing assay was conducted to analyze the migration ability of MC38 cells in miR-122 mimic and control groups at 0 h and 24 h; G Colony formation assay to assess the proliferation and colony-forming ability of MC38 cells in miR-122 mimic and control groups; H Transwell assay to assess the invasion ability of MC38 cells in miR-122 mimic and control groups; I TargetScan to predict that NEGR1 is a potential target of miR-122; J Dual-fluorescence assay to evaluate the expression level of NEGR1 in MC38 cells in the pc- NEGR1 and control groups; K Western blot to detect NEGR1 protein expression levels in control, miR-122 mimic, pc- NEGR1 , and miR-122 mimic + pc- NEGR1 groups; L Western blot and qRT-PCR were used to detect the expression level of NEGR1 in the RNA-pulldown assay. ns p ≥ 0.05, *p < 0.05, **p < 0.01, ***p < 0.001

Article Snippet: The cells were cultured in a DMEM (Keygen Biotech, China) high-glucose medium containing 10% fetal bovine serum (FBS) (Procell, China) and incubated in a constant temperature incubator at 37 °C with 5% CO 2 . miR-122 mimic or pc- NEGR1 (Genechem, China) was transfected into the MC38 cell line using Lipofectamine 2000 reagent following the manufacturer’s instructions(Thermo, USA).

Techniques: Cell Function Assay, Quantitative RT-PCR, Expressing, Control, Wound Healing Assay, Migration, Colony Assay, Transwell Assay, Fluorescence, Western Blot

Knockdown of NEGR1 in vivo promotes colorectal cancer liver metastasis by activating the PI3K/AKT pathway and inducing macrophage M2 polarization. A qRT-PCR detection of NEGR1 expression in MC38 cells from sh-NC and sh- NEGR1 groups; B Western blot detection of protein expression of NEGR1 , p-PI3K, PI3K, p-AKT, and AKT in MC38 cells from sh-NC and sh- NEGR1 groups and after intervention with LY294002, respectively levels; C Representative images of the livers of CRLM mice in sh-NC and sh- NEGR1 groups and counting the number of liver metastases and liver weight; D IF staining to detect the expression of CD206 and iNOS in liver metastases; E – H ELISA to detect the expression levels of IL-10, TGF-β, IL-1β, and TNF-α in liver metastases; I Immunofluorescence detection of F4/80 expression in the livers of CLD-treated or non-CLD-treated CRLM mice; J Representative images of the livers of CRLM mice in the sh-NC or sh- NEGR1 group intervened or non-intervened with CLD and counted the number of liver metastases and liver weight. ns p ≥ 0.05, *p < 0.05, **p < 0.01, ***p < 0.001, ****p < 0.0001

Journal: Journal of Translational Medicine

Article Title: miR-122/NEGR1 axis contributes colorectal cancer liver metastasis by PI3K/AKT pathway and macrophage modulation

doi: 10.1186/s12967-024-05901-5

Figure Lengend Snippet: Knockdown of NEGR1 in vivo promotes colorectal cancer liver metastasis by activating the PI3K/AKT pathway and inducing macrophage M2 polarization. A qRT-PCR detection of NEGR1 expression in MC38 cells from sh-NC and sh- NEGR1 groups; B Western blot detection of protein expression of NEGR1 , p-PI3K, PI3K, p-AKT, and AKT in MC38 cells from sh-NC and sh- NEGR1 groups and after intervention with LY294002, respectively levels; C Representative images of the livers of CRLM mice in sh-NC and sh- NEGR1 groups and counting the number of liver metastases and liver weight; D IF staining to detect the expression of CD206 and iNOS in liver metastases; E – H ELISA to detect the expression levels of IL-10, TGF-β, IL-1β, and TNF-α in liver metastases; I Immunofluorescence detection of F4/80 expression in the livers of CLD-treated or non-CLD-treated CRLM mice; J Representative images of the livers of CRLM mice in the sh-NC or sh- NEGR1 group intervened or non-intervened with CLD and counted the number of liver metastases and liver weight. ns p ≥ 0.05, *p < 0.05, **p < 0.01, ***p < 0.001, ****p < 0.0001

Article Snippet: The cells were cultured in a DMEM (Keygen Biotech, China) high-glucose medium containing 10% fetal bovine serum (FBS) (Procell, China) and incubated in a constant temperature incubator at 37 °C with 5% CO 2 . miR-122 mimic or pc- NEGR1 (Genechem, China) was transfected into the MC38 cell line using Lipofectamine 2000 reagent following the manufacturer’s instructions(Thermo, USA).

Techniques: Knockdown, In Vivo, Quantitative RT-PCR, Expressing, Western Blot, Staining, Enzyme-linked Immunosorbent Assay, Immunofluorescence

Knockdown of NEGR1 Promotes Macrophage M2 Polarization In Vitro. A – E ELISA detected the expression levels of IL-10, TGF-β, IL-1β, and TNF-α in the supernatant of tumor culture medium, respectively. F IF detected the expression of CD206 and iNOS in BMDM co-cultured with MC38/sh- NEGR1 (sn) and the control group. G – J qRT-PCR detected the expression of ARG1, MRC1, CD86, and NOS2 in BMDM in each group, respectively. ns p ≥ 0.05. ARG1, MRC1, CD86, and NOS2 expression in BMDM. ns p ≥ 0.05, *p < 0.05, **p < 0.01

Journal: Journal of Translational Medicine

Article Title: miR-122/NEGR1 axis contributes colorectal cancer liver metastasis by PI3K/AKT pathway and macrophage modulation

doi: 10.1186/s12967-024-05901-5

Figure Lengend Snippet: Knockdown of NEGR1 Promotes Macrophage M2 Polarization In Vitro. A – E ELISA detected the expression levels of IL-10, TGF-β, IL-1β, and TNF-α in the supernatant of tumor culture medium, respectively. F IF detected the expression of CD206 and iNOS in BMDM co-cultured with MC38/sh- NEGR1 (sn) and the control group. G – J qRT-PCR detected the expression of ARG1, MRC1, CD86, and NOS2 in BMDM in each group, respectively. ns p ≥ 0.05. ARG1, MRC1, CD86, and NOS2 expression in BMDM. ns p ≥ 0.05, *p < 0.05, **p < 0.01

Article Snippet: The cells were cultured in a DMEM (Keygen Biotech, China) high-glucose medium containing 10% fetal bovine serum (FBS) (Procell, China) and incubated in a constant temperature incubator at 37 °C with 5% CO 2 . miR-122 mimic or pc- NEGR1 (Genechem, China) was transfected into the MC38 cell line using Lipofectamine 2000 reagent following the manufacturer’s instructions(Thermo, USA).

Techniques: Knockdown, In Vitro, Enzyme-linked Immunosorbent Assay, Expressing, Cell Culture, Control, Quantitative RT-PCR

Knockdown of NEGR1 Promotes Macrophage IL-10 Secretion for Tumor Progression. A – D Expression levels of cytokines IL-10, TGF-β, IL-1β, and TNF-α in the supernatant of BMDM co-cultured with tumors; E Expression of IL-10 in the liver of mice after AS101 intervention. F Representative images of the livers of CRLM mice in sh-NC, sh- NEGR1 , sh-NC + AS101, and sh- NEGR1 + AS101 groups and statistics of the number of hepatic metastases and liver weights. ns p ≥ 0.05, *p < 0.05, ****p < 0.0001

Journal: Journal of Translational Medicine

Article Title: miR-122/NEGR1 axis contributes colorectal cancer liver metastasis by PI3K/AKT pathway and macrophage modulation

doi: 10.1186/s12967-024-05901-5

Figure Lengend Snippet: Knockdown of NEGR1 Promotes Macrophage IL-10 Secretion for Tumor Progression. A – D Expression levels of cytokines IL-10, TGF-β, IL-1β, and TNF-α in the supernatant of BMDM co-cultured with tumors; E Expression of IL-10 in the liver of mice after AS101 intervention. F Representative images of the livers of CRLM mice in sh-NC, sh- NEGR1 , sh-NC + AS101, and sh- NEGR1 + AS101 groups and statistics of the number of hepatic metastases and liver weights. ns p ≥ 0.05, *p < 0.05, ****p < 0.0001

Article Snippet: The cells were cultured in a DMEM (Keygen Biotech, China) high-glucose medium containing 10% fetal bovine serum (FBS) (Procell, China) and incubated in a constant temperature incubator at 37 °C with 5% CO 2 . miR-122 mimic or pc- NEGR1 (Genechem, China) was transfected into the MC38 cell line using Lipofectamine 2000 reagent following the manufacturer’s instructions(Thermo, USA).

Techniques: Knockdown, Expressing, Cell Culture