|
Miltenyi Biotec
cd34 microbead kit  Cd34 Microbead Kit, supplied by Miltenyi Biotec, used in various techniques. Bioz Stars score: 99/100, based on 1 PubMed citations. ZERO BIAS - scores, article reviews, protocol conditions and more https://www.bioz.com/product/late-pcr+sample+preparation/pmc06211564-696-16-19?v=Miltenyi+Biotec Average 99 stars, based on 1 article reviews
cd34 microbead kit - by Bioz Stars,
2026-08
99/100 stars
|
Buy from Supplier |
|
Miltenyi Biotec
anti human cd3 microbeads 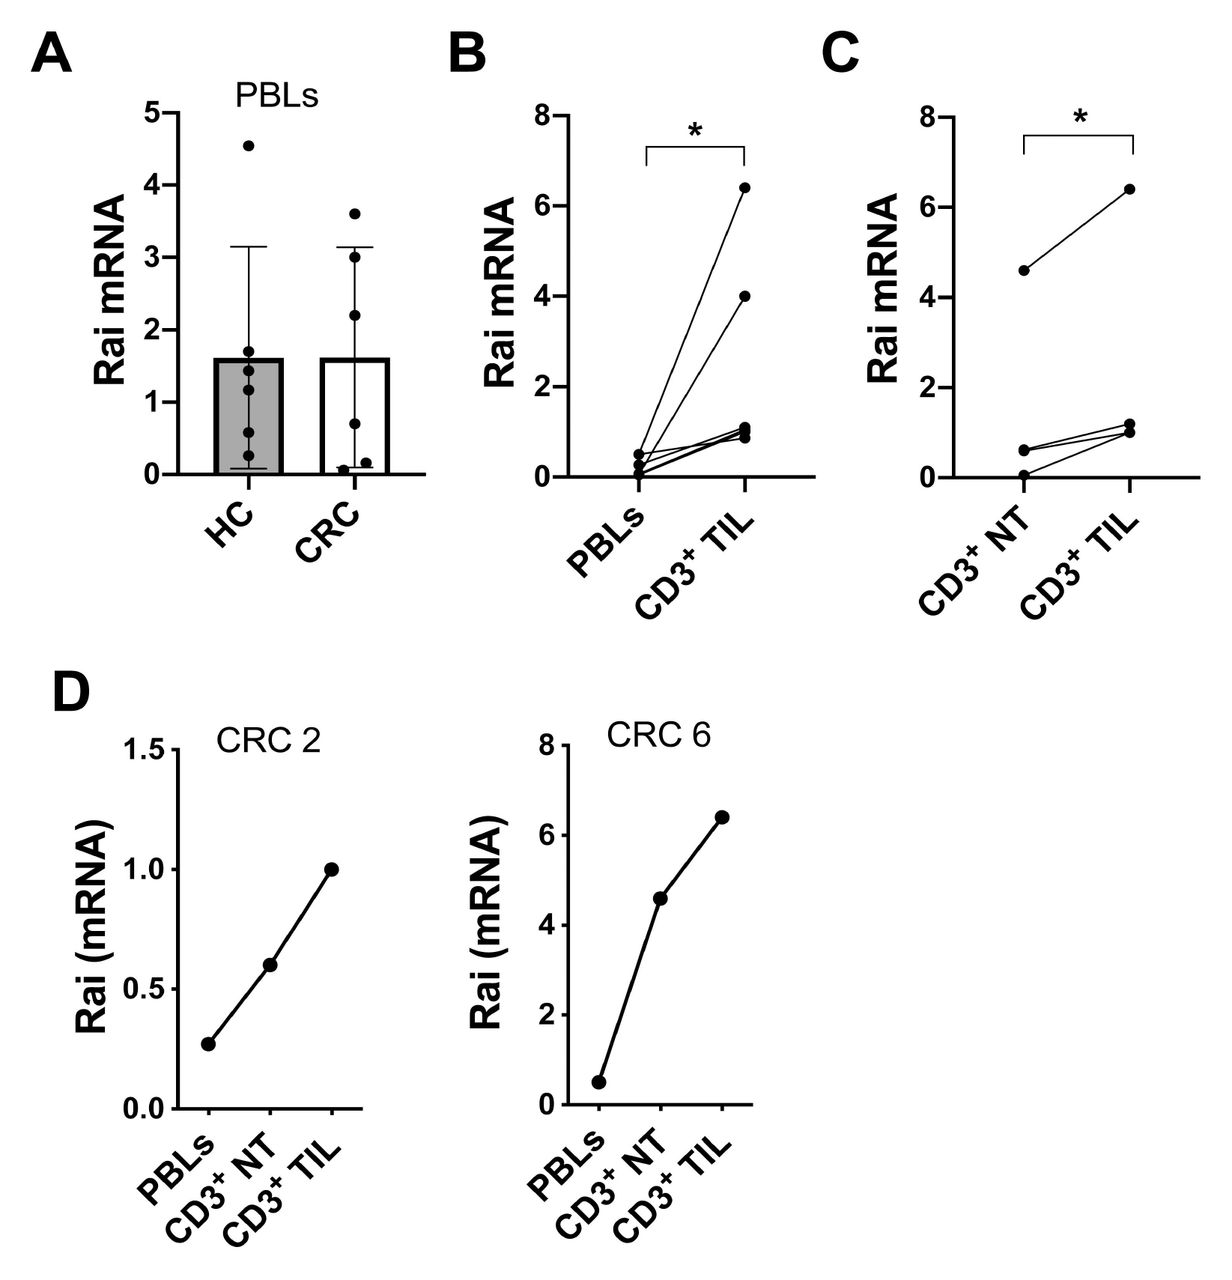 Anti Human Cd3 Microbeads, supplied by Miltenyi Biotec, used in various techniques. Bioz Stars score: 99/100, based on 1 PubMed citations. ZERO BIAS - scores, article reviews, protocol conditions and more https://www.bioz.com/product/late-pcr+sample+preparation/bio_rxiv__2023__06__23__546212-35-13-16?v=Miltenyi+Biotec Average 99 stars, based on 1 article reviews
anti human cd3 microbeads - by Bioz Stars,
2026-08
99/100 stars
|
Buy from Supplier |
Image Search Results
Journal: Cell
Article Title: CBFβ-SMMHC inhibition triggers apoptosis by disrupting MYC chromatin dynamics in acute myeloid leukemia
doi: 10.1016/j.cell.2018.05.048
Figure Lengend Snippet: (A) Analysis of ATAC-seq and K3K27ac and RUNX1 ChIP-seq profiles in a 2 Mb genomic region downstream of MYC. The three enhancer regions (ME1, ME2 and BDME) are depicted in green. (B-D) ChIP-qPCR analysis for RUNX1 in DMSO or AI-10–49 treated cells (B), in DMSO or AI-10–49 treated human primary CD34+ inv(16) AML cells (C), and for p300 in DMSO or AI-10–49 treated ME1 (D). (E) 5C interaction matrices for the MYC locus (−1Mb to +3Mb) in DMSO (left panel) and AI-10–49 (middle panel) treated ME-1 cells. The right panel shows the log2(AI-10–49/DMSO) ratio of the interaction matrices (blue color scheme: higher interaction frequencies in DMSO treated cells; orange color scheme: higher interaction frequencies in AI-10–49 treated cells). Arrows indicate TAD boundaries, arrowhead points to an example of a CTCF-CTCF looping interaction. Significance was calculated using unpaired t-test, *P < 0.05, or **P < 0.005. See also Figures S5 and S6.
Article Snippet: For ChIP qPCR in human primary AML sample with inv(16), CD34 + cells were enriched using
Techniques: ChIP-sequencing, ChIP-qPCR

Journal: Cell
Article Title: CBFβ-SMMHC inhibition triggers apoptosis by disrupting MYC chromatin dynamics in acute myeloid leukemia
doi: 10.1016/j.cell.2018.05.048
Figure Lengend Snippet: (A) Heat map representation of differentially expressed genes in RNA-seq analysis between DMSO and AI-10–49 treated ME-1 cells. A total of 591 genes (in red) are up- and 696 genes (in blue) down-regulated in AI-10–49 treated cells (>2fold change, FDR<0.01). (B) Gene set enrichment analysis showing biological processes and signaling pathways correlated with AI-10–49-treatment. (FDR) false discovery rate; (NES) normalized enrichment score. (C) MYC transcript levels in ME-1 cells treated with DMSO (D) or AI-10–49 (49), estimated by RT-PCR. (D) MYC, ERK and LMO1 nascent transcript levels in treated ME-1 cells, estimated by transient transcriptome qRT-PCR. (E) MYC protein levels in treated ME-1 cells, by immunoblotting. (F, G) MYC transcriptional levels in mouse lineage negative wild type bone marrow (mu wt Lin- BM) and lineage negative CBFβ+/MYH11 leukemic cells (F), and human CD34+ cord blood (HPCs) and human primary CD34+ inv(16) AML cells (G); each symbol represents the average of a triplicate experiment, and the average value of three samples is shown in red. Experiments in A, C and D were performed in triplicate treatments. Error bars represent the SD. Significance was calculated using unpaired t-test (C, D, F and G), *P < 0.05, or **P < 0.005. See also Figure S1.
Article Snippet: For ChIP qPCR in human primary AML sample with inv(16), CD34 + cells were enriched using
Techniques: RNA Sequencing, Protein-Protein interactions, Reverse Transcription Polymerase Chain Reaction, Quantitative RT-PCR, Western Blot

Journal: Cell
Article Title: CBFβ-SMMHC inhibition triggers apoptosis by disrupting MYC chromatin dynamics in acute myeloid leukemia
doi: 10.1016/j.cell.2018.05.048
Figure Lengend Snippet: KEY RESOURCES TABLE
Article Snippet: For ChIP qPCR in human primary AML sample with inv(16), CD34 + cells were enriched using
Techniques: Recombinant, SYBR Green Assay, Extraction, Proliferation Assay, Sample Prep, shRNA, Plasmid Preparation, Cloning, Software, Red Blood Cell Lysis, Transfection, Protease Inhibitor, Gel Extraction
Journal: bioRxiv
Article Title: Human colorectal cancer: upregulation of the adaptor protein Rai in TILs leads to cell dysfunction by sustaining GSK-3 activation and PD-1 expression
doi: 10.1101/2023.06.23.546212
Figure Lengend Snippet: (A) qRT-PCR analysis of Rai transcripts in PBLs of CRC patients (CRC) and healthy controls (HC). The relative gene transcript abundance was determined using dCt method and normalized to HPRT. (B, C) Comparison of Rai expression in PBLs, CD3 + tumour infiltrating lymphocytes (TIL) and CD3 + lymphocytes from tumor-adjacent normal tissue (NT) in matched samples from CRC patients. Data are presented as mean value ± SD (PBLs: n= 6 for CRC, n=7 for HC; TILs: n= 4, NT: n=4). (D) qRT-PCR analysis of Rai transcripts in PBLs, CD3 + lymphocytes in tumor-adjacent normal tissue (NT) and in TILs of 2 CRC patients. Wilcoxon matched-pairs signed rank test (B), paired t test (C). * p ≤ 0.02.
Article Snippet: Then, lymphocytes were magnetically isolated from dissociated CT, HM and PBMC samples with
Techniques: Quantitative RT-PCR, Comparison, Expressing
Journal: bioRxiv
Article Title: Human colorectal cancer: upregulation of the adaptor protein Rai in TILs leads to cell dysfunction by sustaining GSK-3 activation and PD-1 expression
doi: 10.1101/2023.06.23.546212
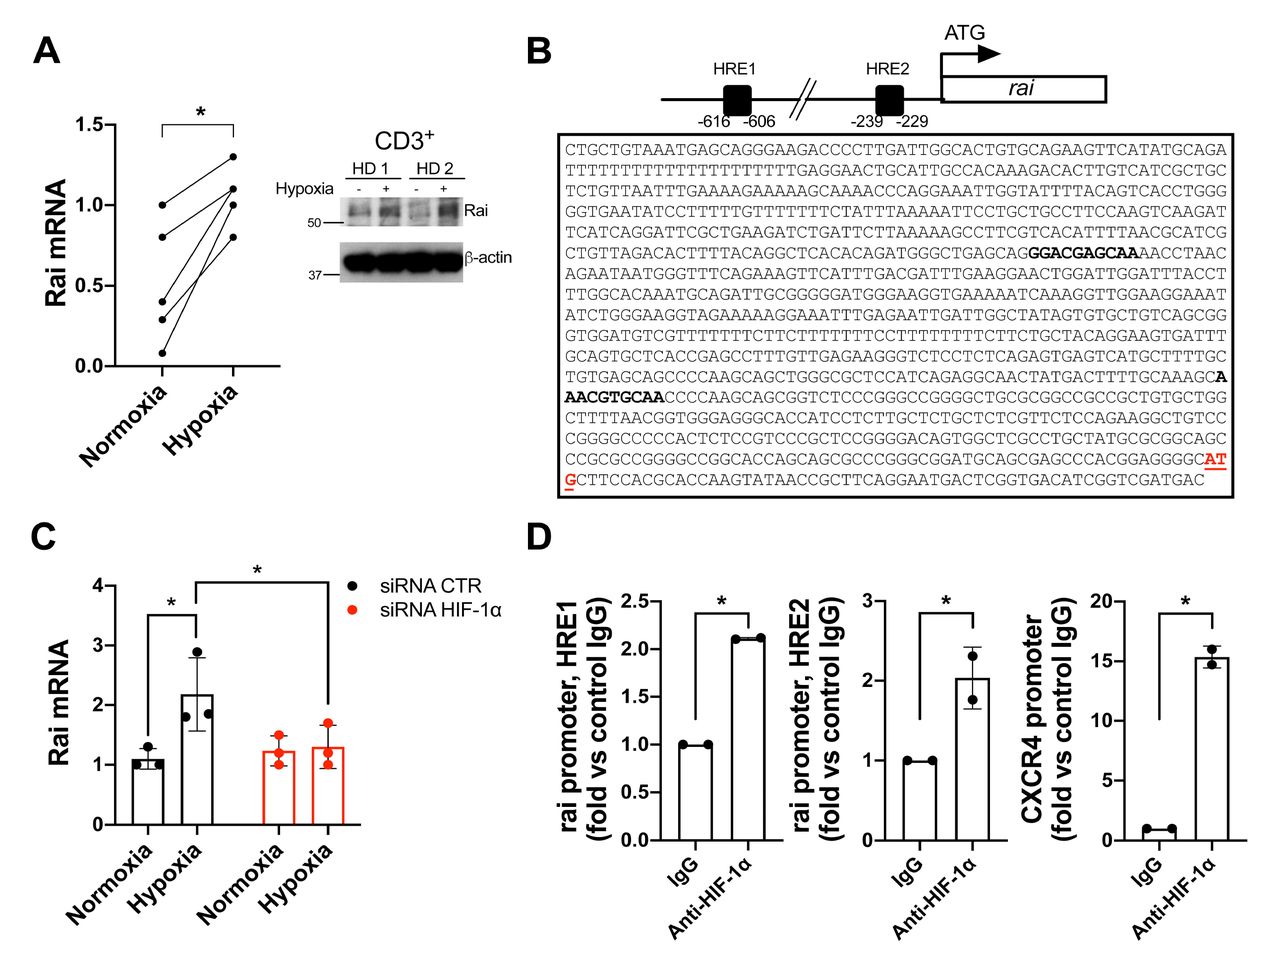
Figure Lengend Snippet: (A) qRT-PCR and immunoblot analysis of Rai expression in CD3 + lymphocytes isolated from blood cultured under normoxic (Norm) or hypoxic (Hypo) conditions for 24 hr. Paired t test (qPCR: n = 5). * p = 0.01. (B) Schematic representation and sequence of the human rai promoter (nucleotides −958 to + 1). Black squares in the scheme and bold character in the sequence indicate the position of hypoxia-response elements (HRE) predicted by in silico analysis (score > 7). (C) qRT-PCR analysis of Rai transcripts in CD3 + lymphocytes silenced (siRNA HIF-1α) or not (siRNA CTR) for HIF-1α and cultured under normoxic (Normoxia) or hypoxic (Hypoxia) conditions for 24 hr. Data are presented as mean value ± SD (n = 3 healthy donors). Two-way ANOVA, Sidak’s multiple comparison test. * p ≤ 0.02. (D) ChIP assays of nuclear extracts of CD3 + lymphocytes cultured under hypoxic (Hypo) conditions for 24 hr using either anti-HIF1α or control unspecific Rabbit IgG (IgG) antibodies. Selected regions of rai promoters containing putative binding sites for HIF-1α showed in (A) were amplified by qPCR. Data are presented as a percentage of input DNA (n =3).
Article Snippet: Then, lymphocytes were magnetically isolated from dissociated CT, HM and PBMC samples with
Techniques: Quantitative RT-PCR, Western Blot, Expressing, Isolation, Cell Culture, Sequencing, In Silico, Comparison, Control, Binding Assay, Amplification

Journal: bioRxiv
Article Title: Human colorectal cancer: upregulation of the adaptor protein Rai in TILs leads to cell dysfunction by sustaining GSK-3 activation and PD-1 expression
doi: 10.1101/2023.06.23.546212
Figure Lengend Snippet: (A) Representative immunoblot of exogenous Rai protein expression in CD3 + lymphocytes transiently co-transfected with the pcDNA3.1 and pmax-GFP plasmids (empty vector) or with the pcDNA3.1-Rai and pmax-GFP plasmids (Rai). (B) Flow cytometric analysis of the percentage of PD-1 positive cells (PD-1 + ) and qRT-PCR of PD-1 and Tbet transcripts in transfected T cells (GFP + ) either untreated (NS) or activated with anti-CD3 and anti-CD28 (3+28) antibodies for 24 h. Representative flow cytometric histograms and gating strategy are shown. Data are presented as mean value ± SD. qRT-PCR data are presented as fold change of treated versus untreated sample (4 healthy donors, empty vector: 4 independent transfections, construct encoding Rai: 4 independent transfections). Flow cytometry data: Two-way ANOVA, Sidak’s multiple comparison test. * p < 0.05; *** p < 0.0002; **** p < 0.0001; qRT-PCR: unpaired t test. * p < 0.05. (C) Flow cytometric analysis of inactive GSK-3 (phosphorylated on Serine 9 and Serine 21, p-GSK3) in transfected T cells (GFP + ) treated as in (B). Flow cytometric profiles of p-GSK-3 of Rai-transfected and mock-transfected cells following CD3+CD28 treatment. Data are presented as mean value ± SD (3 healthy donors, empty vector: 3 independent transfections, Rai: 3 independent transfections). Two-way ANOVA, Sidak’s multiple comparison test. * p < 0.05; *** p < 0.0007.
Article Snippet: Then, lymphocytes were magnetically isolated from dissociated CT, HM and PBMC samples with
Techniques: Western Blot, Expressing, Transfection, Plasmid Preparation, Quantitative RT-PCR, Construct, Flow Cytometry, Comparison