|
StressMarq
pfhsp70 Pfhsp70, supplied by StressMarq, used in various techniques. Bioz Stars score: 93/100, based on 1 PubMed citations. ZERO BIAS - scores, article reviews, protocol conditions and more https://www.bioz.com/result/pfhsp70/product/StressMarq Average 93 stars, based on 1 article reviews
pfhsp70 - by Bioz Stars,
2026-03
93/100 stars
|
Buy from Supplier |
|
R&D Systems
rabbit anti hsp70 af1663 Rabbit Anti Hsp70 Af1663, supplied by R&D Systems, used in various techniques. Bioz Stars score: 94/100, based on 1 PubMed citations. ZERO BIAS - scores, article reviews, protocol conditions and more https://www.bioz.com/result/rabbit anti hsp70 af1663/product/R&D Systems Average 94 stars, based on 1 article reviews
rabbit anti hsp70 af1663 - by Bioz Stars,
2026-03
94/100 stars
|
Buy from Supplier |
|
Santa Cruz Biotechnology
hsp70 ![Fig. 3. <t>Hsp70</t> plays a critical role in cancer cell growth and survival under mechanical stress in the stiff hydrogel. (A) Heatmap of heat shock protein (Hsp)−asso- ciated gene expression determined by RNA sequencing (RNA-seq) comparing cancer cells in the soft, intermediate, and stiff hydrogels (N = 3). The unit for the color scale was the z score of the log2 expression data shown. All RNA-seq data were normalized to the tissue culture plate (TCP) group. Fluorescent images of staining against (B) Hsp70 (green) from day 1 to 3 and (F) heat shock factors (HSF-1; green) on day 5 with F-actin (red) and nuclei (blue) in the encapsulated CRCs as well as the fluorescence intensity measurement of Hsp70 on day 3 and nuclear localization ratio of HSF-1 on day 5, respectively (n = 60 colonies from N = 3 independent hydrogels, each point representing one colony). Scale bars, 20 μm [(B) and (F)]. (C) Quantification of Hsp70 protein (left) and gene (right) expression by cancer cells in different groups over 72 hours (N = 4, each point representing an independent hydrogel). (D) Schematic illustration of uniaxial compression on cancer cells encapsulated in intermediate stiffness hydrogel and images of fluorescence staining against Hsp70 in cancer cells with or without small interfering RNA (siRNA) knockdown of Hsp70 (siRNA-Hsp70) under varying levels of compression on day 3. Scale bars, 25 μm. (E) Apoptosis rates of CRCs cultured in the intermediate stiffness hydrogel with or without siRNA-Hsp70 under various magnitudes of uniaxial compression on day 3 (N = 4 independent samples). Data represent the means ± SD. Significant difference P values: *P < 0.05 and ***P < 0.001 (ANOVA).](https://pub-med-unpaywalled-images-cdn.bioz.com/pub_med_ids_ending_with_8519/pm37418519/pm37418519__page5_image1.jpg) Hsp70, supplied by Santa Cruz Biotechnology, used in various techniques. Bioz Stars score: 96/100, based on 1 PubMed citations. ZERO BIAS - scores, article reviews, protocol conditions and more https://www.bioz.com/result/hsp70/product/Santa Cruz Biotechnology Average 96 stars, based on 1 article reviews
hsp70 - by Bioz Stars,
2026-03
96/100 stars
|
Buy from Supplier |
|
Proteintech
anti hsp70 antibody  Anti Hsp70 Antibody, supplied by Proteintech, used in various techniques. Bioz Stars score: 96/100, based on 1 PubMed citations. ZERO BIAS - scores, article reviews, protocol conditions and more https://www.bioz.com/result/anti hsp70 antibody/product/Proteintech Average 96 stars, based on 1 article reviews
anti hsp70 antibody - by Bioz Stars,
2026-03
96/100 stars
|
Buy from Supplier |
|
StressMarq
monoclonal hsp70 antibody conjugated to fitc Monoclonal Hsp70 Antibody Conjugated To Fitc, supplied by StressMarq, used in various techniques. Bioz Stars score: 93/100, based on 1 PubMed citations. ZERO BIAS - scores, article reviews, protocol conditions and more https://www.bioz.com/result/monoclonal hsp70 antibody conjugated to fitc/product/StressMarq Average 93 stars, based on 1 article reviews
monoclonal hsp70 antibody conjugated to fitc - by Bioz Stars,
2026-03
93/100 stars
|
Buy from Supplier |
|
Cell Signaling Technology Inc
hsp70  Hsp70, supplied by Cell Signaling Technology Inc, used in various techniques. Bioz Stars score: 95/100, based on 1 PubMed citations. ZERO BIAS - scores, article reviews, protocol conditions and more https://www.bioz.com/result/hsp70/product/Cell Signaling Technology Inc Average 95 stars, based on 1 article reviews
hsp70 - by Bioz Stars,
2026-03
95/100 stars
|
Buy from Supplier |
|
Addgene inc
t2a p65ad hsp70 plasmid T2a P65ad Hsp70 Plasmid, supplied by Addgene inc, used in various techniques. Bioz Stars score: 91/100, based on 1 PubMed citations. ZERO BIAS - scores, article reviews, protocol conditions and more https://www.bioz.com/result/t2a p65ad hsp70 plasmid/product/Addgene inc Average 91 stars, based on 1 article reviews
t2a p65ad hsp70 plasmid - by Bioz Stars,
2026-03
91/100 stars
|
Buy from Supplier |
|
Cell Signaling Technology Inc
anti hsp70 Anti Hsp70, supplied by Cell Signaling Technology Inc, used in various techniques. Bioz Stars score: 97/100, based on 1 PubMed citations. ZERO BIAS - scores, article reviews, protocol conditions and more https://www.bioz.com/result/anti hsp70/product/Cell Signaling Technology Inc Average 97 stars, based on 1 article reviews
anti hsp70 - by Bioz Stars,
2026-03
97/100 stars
|
Buy from Supplier |
|
Santa Cruz Biotechnology
anti hsp70 Anti Hsp70, supplied by Santa Cruz Biotechnology, used in various techniques. Bioz Stars score: 95/100, based on 1 PubMed citations. ZERO BIAS - scores, article reviews, protocol conditions and more https://www.bioz.com/result/anti hsp70/product/Santa Cruz Biotechnology Average 95 stars, based on 1 article reviews
anti hsp70 - by Bioz Stars,
2026-03
95/100 stars
|
Buy from Supplier |
|
Addgene inc
pbs hsp70 cas9 plasmid 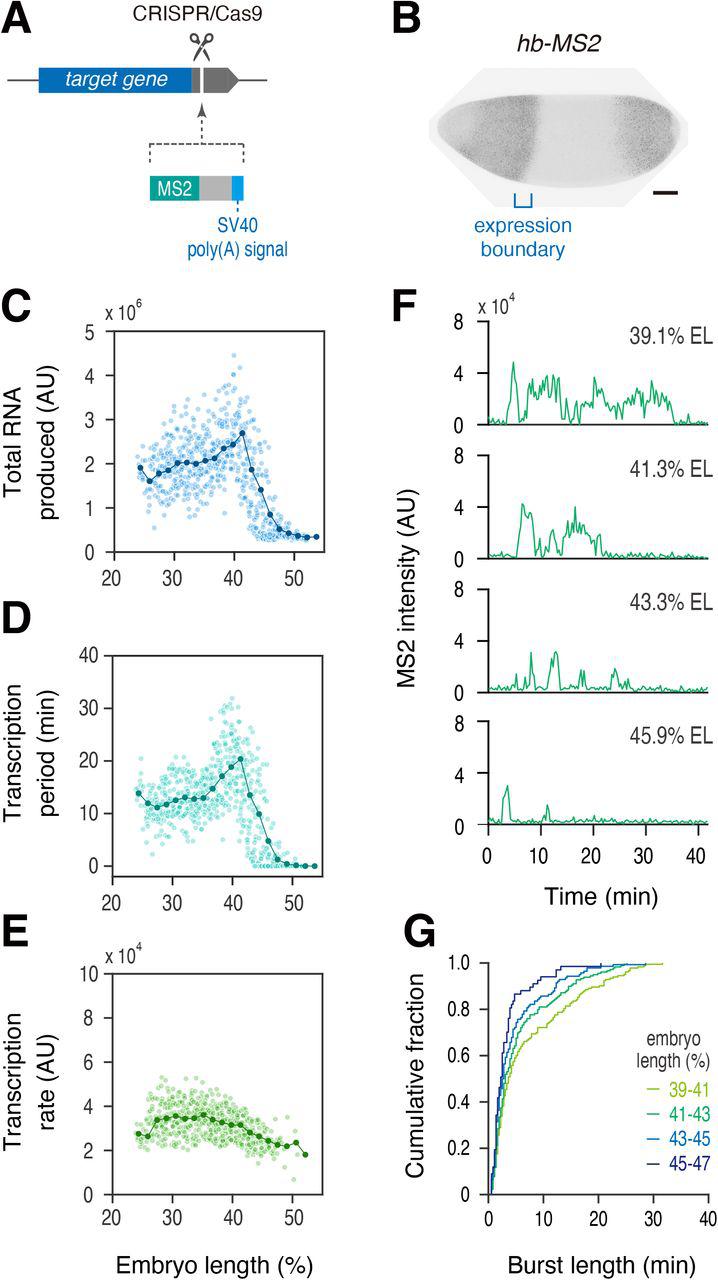 Pbs Hsp70 Cas9 Plasmid, supplied by Addgene inc, used in various techniques. Bioz Stars score: 93/100, based on 1 PubMed citations. ZERO BIAS - scores, article reviews, protocol conditions and more https://www.bioz.com/result/pbs hsp70 cas9 plasmid/product/Addgene inc Average 93 stars, based on 1 article reviews
pbs hsp70 cas9 plasmid - by Bioz Stars,
2026-03
93/100 stars
|
Buy from Supplier |
|
Addgene inc
pbs ks attb2 sa 0 t2a vp16ad hsp70 Pbs Ks Attb2 Sa 0 T2a Vp16ad Hsp70, supplied by Addgene inc, used in various techniques. Bioz Stars score: 94/100, based on 1 PubMed citations. ZERO BIAS - scores, article reviews, protocol conditions and more https://www.bioz.com/result/pbs ks attb2 sa 0 t2a vp16ad hsp70/product/Addgene inc Average 94 stars, based on 1 article reviews
pbs ks attb2 sa 0 t2a vp16ad hsp70 - by Bioz Stars,
2026-03
94/100 stars
|
Buy from Supplier |
Image Search Results
Journal: Science advances
Article Title: Mechanical manipulation of cancer cell tumorigenicity via heat shock protein signaling.
doi: 10.1126/sciadv.adg9593
Figure Lengend Snippet: Fig. 3. Hsp70 plays a critical role in cancer cell growth and survival under mechanical stress in the stiff hydrogel. (A) Heatmap of heat shock protein (Hsp)−asso- ciated gene expression determined by RNA sequencing (RNA-seq) comparing cancer cells in the soft, intermediate, and stiff hydrogels (N = 3). The unit for the color scale was the z score of the log2 expression data shown. All RNA-seq data were normalized to the tissue culture plate (TCP) group. Fluorescent images of staining against (B) Hsp70 (green) from day 1 to 3 and (F) heat shock factors (HSF-1; green) on day 5 with F-actin (red) and nuclei (blue) in the encapsulated CRCs as well as the fluorescence intensity measurement of Hsp70 on day 3 and nuclear localization ratio of HSF-1 on day 5, respectively (n = 60 colonies from N = 3 independent hydrogels, each point representing one colony). Scale bars, 20 μm [(B) and (F)]. (C) Quantification of Hsp70 protein (left) and gene (right) expression by cancer cells in different groups over 72 hours (N = 4, each point representing an independent hydrogel). (D) Schematic illustration of uniaxial compression on cancer cells encapsulated in intermediate stiffness hydrogel and images of fluorescence staining against Hsp70 in cancer cells with or without small interfering RNA (siRNA) knockdown of Hsp70 (siRNA-Hsp70) under varying levels of compression on day 3. Scale bars, 25 μm. (E) Apoptosis rates of CRCs cultured in the intermediate stiffness hydrogel with or without siRNA-Hsp70 under various magnitudes of uniaxial compression on day 3 (N = 4 independent samples). Data represent the means ± SD. Significant difference P values: *P < 0.05 and ***P < 0.001 (ANOVA).
Article Snippet: The equivalent amount of the protein of each sample was separated by 8 to 15% SDS–polyacrylamide gel electrophoresis (Beyotime); blocked with 5% fat-free milk powder (Aladdin) for 2 hours at room temperature; and incubated with primary antibodies to
Techniques: Gene Expression, RNA Sequencing, Expressing, Staining, Fluorescence, Small Interfering RNA, Knockdown, Cell Culture

Journal: Science advances
Article Title: Mechanical manipulation of cancer cell tumorigenicity via heat shock protein signaling.
doi: 10.1126/sciadv.adg9593
Figure Lengend Snippet: Fig. 5. The elevated expression of Hsp70 due to mechanical stress enhances cancer cell stemness in the stiff hydrogel. (A) Schematic illustration of the Hsp70/ Hsp90 association assisting phosphorylation of signal transducer and activator of transcription 3 (pSTAT3). (B) Images of immunofluorescence staining against STAT3 (red) and nuclei (blue) in CRCs cultured under various conditions. (C) The Western blot data of Hsp70, Hsp90, STAT3, and pSTAT3 in different groups. (D) Quantification of the nuclear localization of STAT3 in (B). (n = 60, each point represents one nucleus from N = 3 independent hydrogels). (E) Schematic illustration of the transcriptional regulation of Nanog expression by pSTAT3 and its pharmacological blockade by Stattic. (F) Images of immunofluorescence staining against Nanog (green), F-actin (red), and nuclei (blue) in CRCs cultured under various conditions. (G) The Western blot data and (H) relative gene expression of Nanog, sex-determining region Y- box2 (Sox2), and octamer-binding transcription factor 3/4 (Oct3/4) in different groups. (N = 4, each point represents an independent hydrogel). All experiments were assessed on day 5 of culture. Stress relief was performed from day 4 to 5. Data represent the means ± SD. Significant difference P values: *P < 0.05; **P < 0.01; ***P < 0.001 (ANOVA).
Article Snippet: The equivalent amount of the protein of each sample was separated by 8 to 15% SDS–polyacrylamide gel electrophoresis (Beyotime); blocked with 5% fat-free milk powder (Aladdin) for 2 hours at room temperature; and incubated with primary antibodies to
Techniques: Expressing, Phospho-proteomics, Immunofluorescence, Staining, Cell Culture, Western Blot, Gene Expression, Binding Assay
![Fig. 6. Hsp70 is the key mechanosensi- tive mediator contributing to the en- hanced in vivo tumorigenic and metastatic potential of CRCs primed with mechanical stress in the stiff hy- drogel. (A) Volcano plots for differentially expressed genes (DEGs). Gray, non-DEGs; red, up-regulated DEGs; blue, down-reg- ulated DEGs. FDR, false discovery rate. (B) Bubble chart of oncology-related Kyoto Encyclopedia of Genes and Genomes (KEGG) enrichment pathways of DEGs in different groups. The size of the bubbles represents the rich ratio, denoted by the number below the bubble. (C) Schematic illustration of CRCs pretreated in hydro- gels over 5 days and subsequent isolation for subcutaneous or tail vein inoculation into nude mice for in situ–grown tumor model creation over 20 days or for meta- static lung tumor model creation over 2 months with survival time examination, respectively (N = 6 independent mice). Drugs [JG98 and/or doxorubicin (DOX) at 10 mg/kg] or phosphate-buffered saline (PBS) were injected via the tail vein on day 10 after inoculation in both models. (D) Individual growth curves of tumors in animals inoculated by groups (a) to (f), corresponding to each treatment or culture condition. (E) Statistical analysis of end point (day 20) tumor volumes (N = 6 independent mice). (F) Survival curves for each treatment arm and in different groups [N = 6 independent mice, log-rank (Mantel-Cox) test]. (G) Hematoxylin and eosin staining of histological sections of the in situ–grown tumor on Day 20 and lung tumor models on day 30 in different groups. Scale bars, 100 μm. (H) Quantifi- cation of the relative gene expression of Nanog in tissues harvested from the in situ–grown tumors on day 20 (N = 6 in- dependent mice). Data represent the means ± SD. Significant difference P values: *P < 0.05; **P < 0.01; ***P < 0.001. n.s. denotes no significant difference (P > 0.05) (ANOVA).](https://pub-med-unpaywalled-images-cdn.bioz.com/pub_med_ids_ending_with_8519/pm37418519/pm37418519__page9_image1.jpg)
Journal: Science advances
Article Title: Mechanical manipulation of cancer cell tumorigenicity via heat shock protein signaling.
doi: 10.1126/sciadv.adg9593
Figure Lengend Snippet: Fig. 6. Hsp70 is the key mechanosensi- tive mediator contributing to the en- hanced in vivo tumorigenic and metastatic potential of CRCs primed with mechanical stress in the stiff hy- drogel. (A) Volcano plots for differentially expressed genes (DEGs). Gray, non-DEGs; red, up-regulated DEGs; blue, down-reg- ulated DEGs. FDR, false discovery rate. (B) Bubble chart of oncology-related Kyoto Encyclopedia of Genes and Genomes (KEGG) enrichment pathways of DEGs in different groups. The size of the bubbles represents the rich ratio, denoted by the number below the bubble. (C) Schematic illustration of CRCs pretreated in hydro- gels over 5 days and subsequent isolation for subcutaneous or tail vein inoculation into nude mice for in situ–grown tumor model creation over 20 days or for meta- static lung tumor model creation over 2 months with survival time examination, respectively (N = 6 independent mice). Drugs [JG98 and/or doxorubicin (DOX) at 10 mg/kg] or phosphate-buffered saline (PBS) were injected via the tail vein on day 10 after inoculation in both models. (D) Individual growth curves of tumors in animals inoculated by groups (a) to (f), corresponding to each treatment or culture condition. (E) Statistical analysis of end point (day 20) tumor volumes (N = 6 independent mice). (F) Survival curves for each treatment arm and in different groups [N = 6 independent mice, log-rank (Mantel-Cox) test]. (G) Hematoxylin and eosin staining of histological sections of the in situ–grown tumor on Day 20 and lung tumor models on day 30 in different groups. Scale bars, 100 μm. (H) Quantifi- cation of the relative gene expression of Nanog in tissues harvested from the in situ–grown tumors on day 20 (N = 6 in- dependent mice). Data represent the means ± SD. Significant difference P values: *P < 0.05; **P < 0.01; ***P < 0.001. n.s. denotes no significant difference (P > 0.05) (ANOVA).
Article Snippet: The equivalent amount of the protein of each sample was separated by 8 to 15% SDS–polyacrylamide gel electrophoresis (Beyotime); blocked with 5% fat-free milk powder (Aladdin) for 2 hours at room temperature; and incubated with primary antibodies to
Techniques: In Vivo, Isolation, In Situ, Saline, Injection, Staining, Gene Expression

Journal: Science advances
Article Title: Mechanical manipulation of cancer cell tumorigenicity via heat shock protein signaling.
doi: 10.1126/sciadv.adg9593
Figure Lengend Snippet: Fig. 7. The proposed schematic summary of the confining stress–activated Hsp70 signaling to promote the survival, proliferation, and stemness of the cancer cells encapsulated in the stiff hydrogel. (A) The stiff hydrogel imposes high confining stress on the encapsulated cells, leading to the activation of the stretch-activated channel TRPV4 and the associated PI3k/Akt signaling. The activation enhances the phosphorylation and nuclear localization of HSF1, which promotes the expression of Hsp70 to resist anoikis and apoptosis under mechanical stress. Subsequently, the abundant cytosolic Hsp70 associates with Hsp90 to bridge the nuclear localization of STAT3 through enhanced pSTAT3 that promotes the transcription of Nanog and enhances cancer malignancy. The mechanoprimed cancer cells exhibit (B) high tumor- igenicity and (C) high metastatic potential after subcutaneous or intravenous inoculation, respectively.
Article Snippet: The equivalent amount of the protein of each sample was separated by 8 to 15% SDS–polyacrylamide gel electrophoresis (Beyotime); blocked with 5% fat-free milk powder (Aladdin) for 2 hours at room temperature; and incubated with primary antibodies to
Techniques: Activation Assay, Phospho-proteomics, Expressing
Journal: Genomics
Article Title: Effects of spinal cord injury associated exosomes delivered tRF-41 on the progression of spinal cord injury progression.
doi: 10.1016/j.ygeno.2024.110885
Figure Lengend Snippet: Fig. 1. Characterization and cellular uptake of serum-derived exosomes. (A) A transmission electron microscopy used to visualize the morphology and ultrastructure of exosomes. (B) The size distribution of the isolated exosomes determined using a Nanosight NS300 particle size analyser. (C) The expression of exosomes-specific proteins HSP70, CD9, CD63, and TSG101 detected by western blot. (D) Both the healthy control serum-derived exosomes and spinal cord injury (SCI) serum-derived exosomes could be taken up by the HA cells after co-culture. Control-EXO: healthy control serum-derived exosomes; SCI-EXO: SCI serum-derived exosomes.
Article Snippet: After blocked with 5% skimmed milk for 2 h at 37 ◦C, the membranes were incubated with
Techniques: Derivative Assay, Transmission Assay, Electron Microscopy, Isolation, Expressing, Western Blot, Control, Co-Culture Assay
Journal: bioRxiv
Article Title: Impaired HSF1 transactivation drives proteostasis collapse and senescent phenotype of IPF lung fibroblast
doi: 10.1101/2020.04.10.036327
Figure Lengend Snippet: A) Transcript levels for Hsp70, Hsp90 and Hsp40 in human lung fibroblast from IPF and controls. B, C) WB for HSP90, HSP70, HSP40, HSF1, p-HSF1 ser307 , HSF1 K298 sumo in human fibroblast isolated from IPF and controls. D) Quantification of protein aggregation (aggresome) levels by Proteostat staining of IPF lung fibroblast and controls. Western blot images are representative of two different blots and results of densitometry analysis are depicted in bar graphs (n=5-6, per group). Statistical significance was assessed by Student t-test * p<0.05, ** p< 0.01 versus control group.
Article Snippet: Protein samples (20 μg) were solubilized in 4 × Laemmli sample buffer, heated at 95°C for 10 min, centrifuged at 3,000 g for 1 min, loaded on a 10% Tris-HCl-SDS-polyacrylamide gel and run for 1 h at 100 V. Protein was transferred to a nitrocellulose membrane (ThermoFisher, LC2000) and then blocked with Odyssey Blocking Buffer (Li-Cor Biosciences, 927-50000) for 1 h at room temperature followed by incubation overnight at 4°C with a specific primary antibody to p-p53 ser15 (Cell Signaling, 9284S), β-actin (Cell Signaling, 84575S), Lamin B1(Cell Signaling, 13435S), γ-H2AX (Cell Signaling, 2577S), HSP90 (Cell Signaling, 4877S),
Techniques: Isolation, Staining, Western Blot, Control

Journal: bioRxiv
Article Title: Impaired HSF1 transactivation drives proteostasis collapse and senescent phenotype of IPF lung fibroblast
doi: 10.1101/2020.04.10.036327
Figure Lengend Snippet: A) Transcript levels for Hsp70, Hsp90 and Hsp40 in lung fibroblast isolated from mice treated with bleomycin and controls. B) WB for HSP90, HSP70 in fibroblast cells from bleomycin-injured lungs and controls. Densitometry is shown on the right. C) Quantification of protein aggregation (aggresome) levels by Proteostat staining of lung fibroblast isolated from bleomycin-injured mice and controls. Western blot images are representative of two different blots and results of densitometry analysis are depicted in bar graphs (n=5-6, per group). Statistical significance was assessed by Student t-test * p<0.05, ** p< 0.01 versus control group.
Article Snippet: Protein samples (20 μg) were solubilized in 4 × Laemmli sample buffer, heated at 95°C for 10 min, centrifuged at 3,000 g for 1 min, loaded on a 10% Tris-HCl-SDS-polyacrylamide gel and run for 1 h at 100 V. Protein was transferred to a nitrocellulose membrane (ThermoFisher, LC2000) and then blocked with Odyssey Blocking Buffer (Li-Cor Biosciences, 927-50000) for 1 h at room temperature followed by incubation overnight at 4°C with a specific primary antibody to p-p53 ser15 (Cell Signaling, 9284S), β-actin (Cell Signaling, 84575S), Lamin B1(Cell Signaling, 13435S), γ-H2AX (Cell Signaling, 2577S), HSP90 (Cell Signaling, 4877S),
Techniques: Isolation, Staining, Western Blot, Control

Journal: bioRxiv
Article Title: Impaired HSF1 transactivation drives proteostasis collapse and senescent phenotype of IPF lung fibroblast
doi: 10.1101/2020.04.10.036327
Figure Lengend Snippet: A) Transcript levels for Hsp70, Hsp90 and Hsp40 in control and senescent Mlg cells. B, C, D) WB for HSP90, HSP70, HSP40, HSF1, p-HSF1 ser307 , HSF1 K298 sumo in controls and senescent Mlg cells. Densitometry is shown on the right. E) Quantification of protein aggregation (aggresome) levels by Proteostat staining of lung fibroblast controls and senescent. Number of Proteostat positive cells per 100 cells counted (right).Western blot images are representative of two different blots and results of densitometry analysis are depicted in bar graphs (n=6, per group). Statistical significance was assessed by Student t-test * p<0.05, ** p< 0.01 versus control group.
Article Snippet: Protein samples (20 μg) were solubilized in 4 × Laemmli sample buffer, heated at 95°C for 10 min, centrifuged at 3,000 g for 1 min, loaded on a 10% Tris-HCl-SDS-polyacrylamide gel and run for 1 h at 100 V. Protein was transferred to a nitrocellulose membrane (ThermoFisher, LC2000) and then blocked with Odyssey Blocking Buffer (Li-Cor Biosciences, 927-50000) for 1 h at room temperature followed by incubation overnight at 4°C with a specific primary antibody to p-p53 ser15 (Cell Signaling, 9284S), β-actin (Cell Signaling, 84575S), Lamin B1(Cell Signaling, 13435S), γ-H2AX (Cell Signaling, 2577S), HSP90 (Cell Signaling, 4877S),
Techniques: Control, Staining, Western Blot

Journal: bioRxiv
Article Title: Impaired HSF1 transactivation drives proteostasis collapse and senescent phenotype of IPF lung fibroblast
doi: 10.1101/2020.04.10.036327
Figure Lengend Snippet: A) WB for HSF1, p-HSF1 ser307 , HSF1 K298 sumo in control, Mlg+A3, Mlg+H 2 O 2 and Mlg+H 2 O 2 +A3. B) Transcript levels for Hsp70, Hsp90 and Hsp40 in control, Mlg+A3, Mlg+H 2 O 2 and Mlg+H 2 O 2 +A3. C) WB for HSP70, HSP40 in control, Mlg+A3, Mlg+H 2 O 2 and Mlg+H 2 O 2 +A3. D) Quantification of protein aggregation (aggresome) levels by Proteostat staining in control, Mlg+A3, Mlg+H 2 O 2 and Mlg+H 2 O 2 +A3. Number of Proteostat positive cells per 100 cells counted (right).Western blot images are representative of two different blots and results of densitometry analysis are depicted in bar graphs (n=6, per group). Statistical significance was assessed by ANOVA, * p<0.05, ** p< 0.01.
Article Snippet: Protein samples (20 μg) were solubilized in 4 × Laemmli sample buffer, heated at 95°C for 10 min, centrifuged at 3,000 g for 1 min, loaded on a 10% Tris-HCl-SDS-polyacrylamide gel and run for 1 h at 100 V. Protein was transferred to a nitrocellulose membrane (ThermoFisher, LC2000) and then blocked with Odyssey Blocking Buffer (Li-Cor Biosciences, 927-50000) for 1 h at room temperature followed by incubation overnight at 4°C with a specific primary antibody to p-p53 ser15 (Cell Signaling, 9284S), β-actin (Cell Signaling, 84575S), Lamin B1(Cell Signaling, 13435S), γ-H2AX (Cell Signaling, 2577S), HSP90 (Cell Signaling, 4877S),
Techniques: Control, Staining, Western Blot

Journal: bioRxiv
Article Title: Impaired HSF1 transactivation drives proteostasis collapse and senescent phenotype of IPF lung fibroblast
doi: 10.1101/2020.04.10.036327
Figure Lengend Snippet: A) Transcript levels for Hsp70, Hsp90 and Hsp40 in normal volunteers (NV), NV+A3, IPF and IPF+A3. B) Quantification of protein aggregation (aggresome) levels by Proteostat staining in NV, NV+A3, IPF and IPF+A3. Number of Proteostat positive cells per 100 cells counted (right). Statistical significance was assessed by ANOVA * p< 0.05, **p<0.01.
Article Snippet: Protein samples (20 μg) were solubilized in 4 × Laemmli sample buffer, heated at 95°C for 10 min, centrifuged at 3,000 g for 1 min, loaded on a 10% Tris-HCl-SDS-polyacrylamide gel and run for 1 h at 100 V. Protein was transferred to a nitrocellulose membrane (ThermoFisher, LC2000) and then blocked with Odyssey Blocking Buffer (Li-Cor Biosciences, 927-50000) for 1 h at room temperature followed by incubation overnight at 4°C with a specific primary antibody to p-p53 ser15 (Cell Signaling, 9284S), β-actin (Cell Signaling, 84575S), Lamin B1(Cell Signaling, 13435S), γ-H2AX (Cell Signaling, 2577S), HSP90 (Cell Signaling, 4877S),
Techniques: Staining
Journal: bioRxiv
Article Title: Dynamic regulation of anterior-posterior patterning genes in living Drosophila embryos
doi: 10.1101/2020.11.25.395277
Figure Lengend Snippet: (A) Sequence cassette containing 24x MS2 and SV40 poly(A) signal was inserted into the 3′ UTR of target genes by using CRISPR/Cas9. (B) Fluorescent in situ hybridization of endogenous hb-MS2 . Embryo at nc14 was shown. MS2 probe was used for the analysis. Image was cropped and rotated to align embryo (anterior to the left and posterior to the right). Scale bar indicates 50 μm. (C-E) Profiles of total RNA production (C), transcription period (D) and transcription rate (E) as a function of AP position. Line plot indicates mean values in groups of nuclei binned by AP position. In total, 695 nuclei from three independent embryos were analyzed. (F) Representative trajectories of transcription activity of hb-MS2 in individual nuclei. (G) A cumulative plot showing fraction of bursting events (y axis) and length of transcriptional bursting (x axis). A total of 230 nuclei from three independent embryos was analyzed.
Article Snippet: pCFD3 gRNA expression plasmids, pBS-3xP3-GFP donor plasmid and
Techniques: Sequencing, CRISPR, In Situ Hybridization, Activity Assay