|
Miltenyi Biotec
cd2 selection kit  Cd2 Selection Kit, supplied by Miltenyi Biotec, used in various techniques. Bioz Stars score: 93/100, based on 1 PubMed citations. ZERO BIAS - scores, article reviews, protocol conditions and more https://www.bioz.com/result/cd2 selection kit/product/Miltenyi Biotec Average 93 stars, based on 1 article reviews
cd2 selection kit - by Bioz Stars,
2026-06
93/100 stars
|
Buy from Supplier |
|
Miltenyi Biotec
anti cd2 antibody  Anti Cd2 Antibody, supplied by Miltenyi Biotec, used in various techniques. Bioz Stars score: 94/100, based on 1 PubMed citations. ZERO BIAS - scores, article reviews, protocol conditions and more https://www.bioz.com/result/anti cd2 antibody/product/Miltenyi Biotec Average 94 stars, based on 1 article reviews
anti cd2 antibody - by Bioz Stars,
2026-06
94/100 stars
|
Buy from Supplier |
|
Bio-Rad
mouse anti cd2 Mouse Anti Cd2, supplied by Bio-Rad, used in various techniques. Bioz Stars score: 93/100, based on 1 PubMed citations. ZERO BIAS - scores, article reviews, protocol conditions and more https://www.bioz.com/result/mouse anti cd2/product/Bio-Rad Average 93 stars, based on 1 article reviews
mouse anti cd2 - by Bioz Stars,
2026-06
93/100 stars
|
Buy from Supplier |
|
Cell Signaling Technology Inc
b 5 66 x B 5 66 X, supplied by Cell Signaling Technology Inc, used in various techniques. Bioz Stars score: 93/100, based on 1 PubMed citations. ZERO BIAS - scores, article reviews, protocol conditions and more https://www.bioz.com/result/b 5 66 x/product/Cell Signaling Technology Inc Average 93 stars, based on 1 article reviews
b 5 66 x - by Bioz Stars,
2026-06
93/100 stars
|
Buy from Supplier |
|
Elabscience Biotechnology
apc anti human cd206 lw1218  Apc Anti Human Cd206 Lw1218, supplied by Elabscience Biotechnology, used in various techniques. Bioz Stars score: 92/100, based on 1 PubMed citations. ZERO BIAS - scores, article reviews, protocol conditions and more https://www.bioz.com/result/apc anti human cd206 lw1218/product/Elabscience Biotechnology Average 92 stars, based on 1 article reviews
apc anti human cd206 lw1218 - by Bioz Stars,
2026-06
92/100 stars
|
Buy from Supplier |
|
Bio-Rad
mouse α human cd2 mab Mouse α Human Cd2 Mab, supplied by Bio-Rad, used in various techniques. Bioz Stars score: 93/100, based on 1 PubMed citations. ZERO BIAS - scores, article reviews, protocol conditions and more https://www.bioz.com/result/mouse α human cd2 mab/product/Bio-Rad Average 93 stars, based on 1 article reviews
mouse α human cd2 mab - by Bioz Stars,
2026-06
93/100 stars
|
Buy from Supplier |
|
Miltenyi Biotec
mouse anti human cd2 monoclonal antibody  Mouse Anti Human Cd2 Monoclonal Antibody, supplied by Miltenyi Biotec, used in various techniques. Bioz Stars score: 95/100, based on 1 PubMed citations. ZERO BIAS - scores, article reviews, protocol conditions and more https://www.bioz.com/result/mouse anti human cd2 monoclonal antibody/product/Miltenyi Biotec Average 95 stars, based on 1 article reviews
mouse anti human cd2 monoclonal antibody - by Bioz Stars,
2026-06
95/100 stars
|
Buy from Supplier |
|
Cedarlane
anti rcd2 antibody Anti Rcd2 Antibody, supplied by Cedarlane, used in various techniques. Bioz Stars score: 85/100, based on 1 PubMed citations. ZERO BIAS - scores, article reviews, protocol conditions and more https://www.bioz.com/result/anti rcd2 antibody/product/Cedarlane Average 85 stars, based on 1 article reviews
anti rcd2 antibody - by Bioz Stars,
2026-06
85/100 stars
|
Buy from Supplier |
|
Cedarlane
mouse anti cd2 Mouse Anti Cd2, supplied by Cedarlane, used in various techniques. Bioz Stars score: 85/100, based on 1 PubMed citations. ZERO BIAS - scores, article reviews, protocol conditions and more https://www.bioz.com/result/mouse anti cd2/product/Cedarlane Average 85 stars, based on 1 article reviews
mouse anti cd2 - by Bioz Stars,
2026-06
85/100 stars
|
Buy from Supplier |
|
Novus Biologicals
anti human cd2 antibody Anti Human Cd2 Antibody, supplied by Novus Biologicals, used in various techniques. Bioz Stars score: 92/100, based on 1 PubMed citations. ZERO BIAS - scores, article reviews, protocol conditions and more https://www.bioz.com/result/anti human cd2 antibody/product/Novus Biologicals Average 92 stars, based on 1 article reviews
anti human cd2 antibody - by Bioz Stars,
2026-06
92/100 stars
|
Buy from Supplier |
|
Miltenyi Biotec
macsima anticd279 rea1165 pe miltenyi biotec Macsima Anticd279 Rea1165 Pe Miltenyi Biotec, supplied by Miltenyi Biotec, used in various techniques. Bioz Stars score: 93/100, based on 1 PubMed citations. ZERO BIAS - scores, article reviews, protocol conditions and more https://www.bioz.com/result/macsima anticd279 rea1165 pe miltenyi biotec/product/Miltenyi Biotec Average 93 stars, based on 1 article reviews
macsima anticd279 rea1165 pe miltenyi biotec - by Bioz Stars,
2026-06
93/100 stars
|
Buy from Supplier |
|
Proteintech
anti cd2ap Anti Cd2ap, supplied by Proteintech, used in various techniques. Bioz Stars score: 93/100, based on 1 PubMed citations. ZERO BIAS - scores, article reviews, protocol conditions and more https://www.bioz.com/result/anti cd2ap/product/Proteintech Average 93 stars, based on 1 article reviews
anti cd2ap - by Bioz Stars,
2026-06
93/100 stars
|
Buy from Supplier |
Image Search Results
Journal: PLoS ONE
Article Title: Cross-linking of T cell to B cell lymphoma by the T cell bispecific antibody CD20-TCB induces IFNγ/CXCL10-dependent peripheral T cell recruitment in humanized murine model
doi: 10.1371/journal.pone.0241091
Figure Lengend Snippet: a) Workflow schematics: skinfold chambers were installed on NSG mice (day -2). 48 hours later (day 0): WSU DLCL2 (blue), unstained CT26 cells, and CD2 + T cells (pink) freshly purified from human PBMCs or from HSC-NSG mice were injected intra-dermally in the skinfold chamber together with labeled CD20-TCB (0.5 mg/kg) or with suitable vehicle. Cells were imaged 2 hours post treatment by MP-IVM. Adapted from https://smart.servier.com/ . b) 3D representative rendering of MP-IVM imaging on skinfold chamber of HSC-NSG-NSG mice showing localization of therapy (white) at the contact site between WSU DLCL2 cells (blue) and T cells (pink), 2 hours post treatment. c) MP-IVM analysis of T cells tracks in the skin fold chamber of PBMC-NSG (top) vs HSC-NSG-NSG mice (bottom), +/- CD20-TCB. T cell tracks are plotted according to their displacement in the X and Y axes. Total number of tracks for each plot is: Top left: Vehicle n = 330. Top right: CD20-TCB n = 759. Bottom left: Vehicle n = 741. Bottom right: CD20-TCB n = 185. d-e) Quantification of (d) Track Speed (μm/min) and (e) Track displacement (μm) of T cells in PBMC-NSG or HSC-NSG-NSG mice, +/- CD20-TCB. Shown in yellow are mean values +/- s.d. Unpaired t-test; ****p<0.0001; n.s.: not significant.
Article Snippet: Conventional pan T cells from the spleen of HSC-NSG mice were isolated using a
Techniques: Purification, Injection, Labeling, Imaging

Journal: PLoS ONE
Article Title: Cross-linking of T cell to B cell lymphoma by the T cell bispecific antibody CD20-TCB induces IFNγ/CXCL10-dependent peripheral T cell recruitment in humanized murine model
doi: 10.1371/journal.pone.0241091
Figure Lengend Snippet: a-c) Top: Representative histological staining of WSU DLCL2 tumors 24h post second treatment (0.5 mg/kg CD20-TCB or suitable vehicle i.v.). Bottom: Quantification of total number of cells/mm 2 from histological images of vehicle vs CD20-TCB treatment. Whole slide scans quantification of 4 μm FFPE sections with the software (a) Definiens; (b-c) Halo. Statistical analysis: Unpaired 2-tailed t-test with Welch’s correction. *p<0.05, **p<0.005 (a) Red: CD3 staining, brown: CD31 staining. Quantification: Number of CD3 + cells b) red: Ki67, yellow: CD3, blue: DAPI. Quantification: Number of CD3 + Ki67 + cells c) Red: CXCR3, yellow: CD3, Blue: DAPI. Quantification of CD3 + CXCR3 + T cells. d) Percentage of proliferating CD8 + T cells, as assessed by CFSE dilution, freshly purified from PBMCs. Proliferation has been evaluated at 24h, 48h and 72h post CD20-TCB treatment, at the indicated doses, in the presence of WSU DLCL2 cells as target. n = 3 per group, mean and s.d. are shown. One-way Anova, *p<0.05, **p<0.005, ****p<0.0001. e) Workflow schematics: Skinfold chamber were installed on NSG mice. 48h later, WSU DLCL2 (Blue), unstained CT26 cells, and CD2 + T cells freshly purified from HSC-NSG spleens (pink) were injected intra-dermally in the skinfold chamber, together with 0.25 mg/kg of CD20-TCB or with suitable vehicle. Concomitantly, freshly purified CD2 + T cells from HSC-NSG spleens (orange) were injected i.v. to allow visualization of peripheral blood T cells. Cells were imaged 72h post treatment by MP-IVM. f) Representative MP-IVM imaging of the tumors. Blue: WSU DLCL2 cells; Pink: Resident T cells; Orange: Recruited T cells. Images were acquired 72h post intradermal treatment with 0.25 mg/kg CD20-TCB or suitable vehicle. Adapted from https://smart.servier.com/ g) Quantification of peripheral T cells (number/mm 2 ) 72h post treatment. Mean +/- s.d. are shown. Unpaired 2-tailed t-test with Welch’s correction. **p<0.005. h) In the context of the skinfold chamber model, increasing number of T cells (Resident) were co-injected with the tumor and 0.25 mg/kg of CD20-TCB intradermally, while 2.5*10 6 T cells were injected intravenously (Peripheral). 72h post treatment, peripheral blood T cells were counted for each tumor from 5 representative fields. 4 tumors per group were analyzed. Shown is the count of peripheral T cells/mm 2 , Mean +/- s.d. per group. Statistical analysis: One-way Anova. **** p<0.0001. i) 3 hours in vitro chemotaxis assay of T cells toward preconditioned medium derived from WSU DLCL2 co-culture with CD3/CD28 pre-activated T cells. Pre-activated CD8 T cells have been plated with WSU DLCL2 cells at decreasing T cells: Tumor cells ratios, in the presence of 200 ng/ml of CD20-TCB. 24h later the supernatant has been collected and transferred to the bottom chamber of a 24-Transwell plate. In the top chamber 100.000 pre activated T cells, labeled with CFSE, have been seeded and let to migrate for 3 hours. Migration has been evaluated by counting total amount of CFSE positive migrated cells in the bottom chamber, by flow cytometry at constant volume and acquisition speed. Mean fold change and +/- s.d. are shown. n = 5, from two independent experiments 2-way Anova; **p<0.005.
Article Snippet: Conventional pan T cells from the spleen of HSC-NSG mice were isolated using a
Techniques: Staining, Software, Purification, Injection, Imaging, In Vitro, Chemotaxis Assay, Derivative Assay, Co-Culture Assay, Labeling, Migration, Flow Cytometry

Journal: PLoS ONE
Article Title: Cross-linking of T cell to B cell lymphoma by the T cell bispecific antibody CD20-TCB induces IFNγ/CXCL10-dependent peripheral T cell recruitment in humanized murine model
doi: 10.1371/journal.pone.0241091
Figure Lengend Snippet: a) IFNγ protein quantification by multiplex analysis of supernatant derived from co-culture of WSU DLCL2 cells with CD8 + T cells freshly purified from PBMCs and stimulated with CD20-TCB (200 ng/ml) at the indicated time points. n = 3 per group. Two-way Anova. *p< 0.05, **p< 0.05, ***p < 0.001, ****p < 0.0001, n.s.: not significant. b) Flow cytometry analysis of CD8 + INFγ + T cells, at 24, 48 and 72 hours post in vitro CD20-TCB (200 ng/ml) treatment. c) Quantification of released cytokines (pg/mL) upon IFNγ stimulation of WSU DLCL2 tumor cells for 48 hours. Shown is Mean +/- s.d. of 3 replicates. d) Quantification of released cytokines (pg/mL) upon CD20-TCB treatment (200 ng/ml) of WSU DLCL2 co-cultured with CD3/CD28 pre-activated CD8 + T cells. Shown is Mean +/- s.d. n = 4 per group. Two-way Anova *p< 0.05, n.s.: not significant. e) CXCL10 protein quantification by multiplex analysis of supernant derived from co-culture of WSU DLCL2 cells with CD8 + T cells freshly purified from PBMCs and stimulated with CD20-TCB (200 ng/ml) at the indicated time points. n = 3 per group. Two-way Anova. ***p < 0.001, ****p < 0.0001, n.s. not significant. f) Representative images from MP-IVM imaging in the skinfold chamber of HSC-NSG-NSG mice. WSU DLCL2 cells (blue) pre-treated or not with IFNγ were injected intra-dermally together with CD2 + T cells derived from the spleen of HSC-NSG (pink) and 0.25 mg/kg CD20-TCB or suitable vehicle. CD2 + T cells derived from the spleen of HSC-NSG (orange) where concomitantly injected intravenously. Top row: Tumor cells (blue) and peripheral T cells (orange). Bottom row: Tumor cells (blue), resident T cells (pink) and peripheral T cells (orange). Where indicated, antibodies against CXCL10 or IFNγ were injected intravenously. g) Quantification of peripheral blood T cells (count/mm 2 ) 72 hours post treatment. Shown are individual counts/mm 2 and mean +/- s.d. Statistical analysis: One-way Anova. ***p < 0.001, ****p < 0.0001.
Article Snippet: Conventional pan T cells from the spleen of HSC-NSG mice were isolated using a
Techniques: Multiplex Assay, Derivative Assay, Co-Culture Assay, Purification, Flow Cytometry, In Vitro, Cell Culture, Imaging, Injection
Journal: bioRxiv
Article Title: Development of compact transcriptional effectors using high-throughput measurements in diverse contexts
doi: 10.1101/2023.05.12.540558
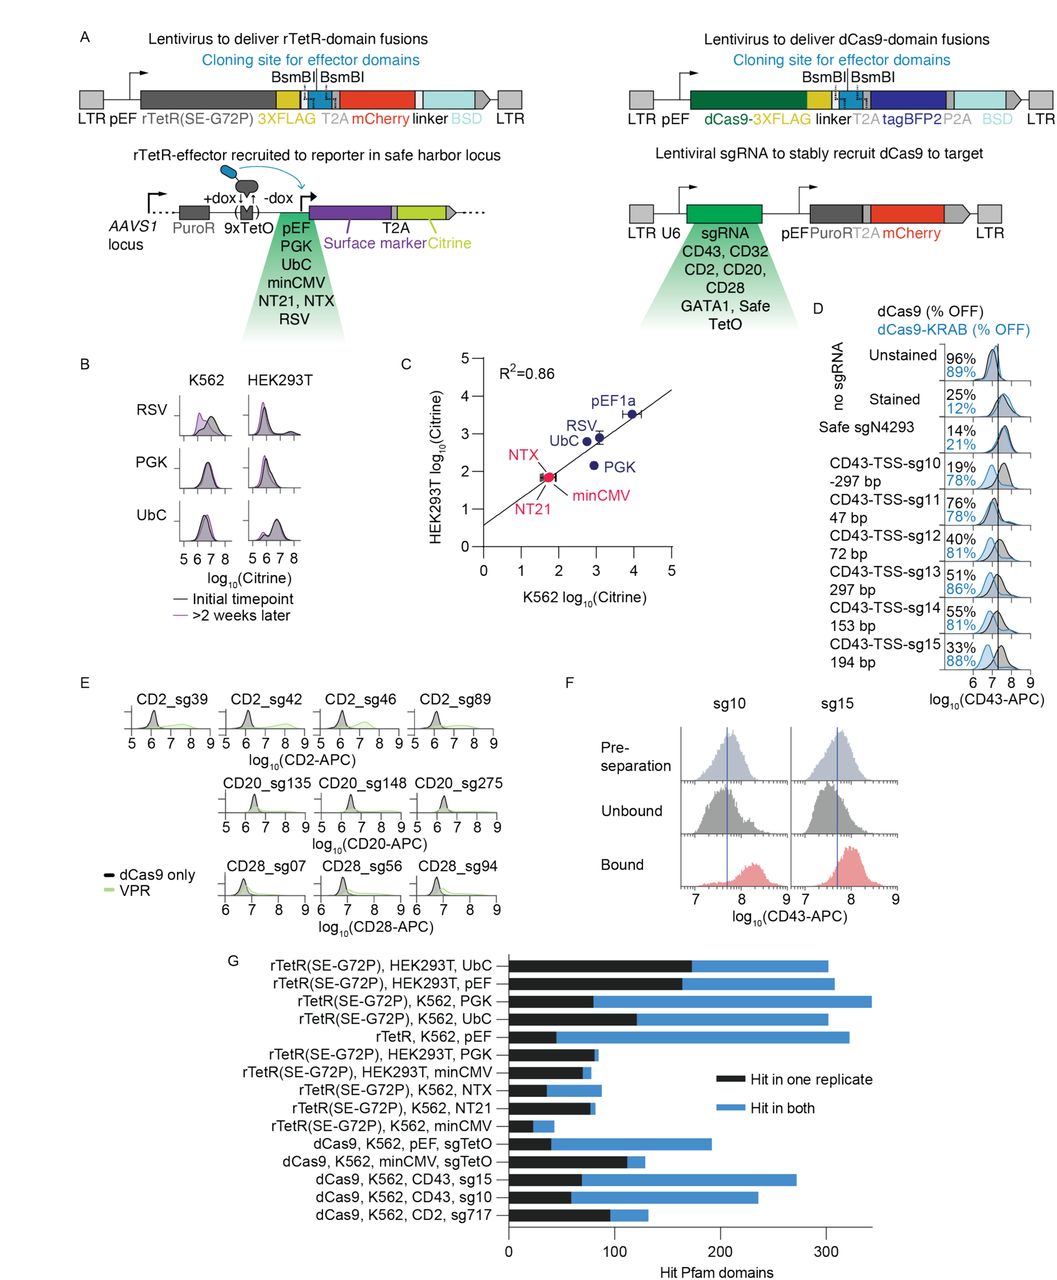
Figure Lengend Snippet: A ) Schematic of high-throughput recruitment (HT-recruit) to quantify transcriptional effector function while varying the context of DNA-binding domains (DBDs), cell type, and target synthetic reporters or endogenous genes. A pooled library of Pfam domains from human nuclear proteins of ≤80 amino acids is synthesized as 300-mer DNA oligonucleotides, cloned downstream of the doxycycline (dox)-inducible rTetR DNA-binding domain (DBD) or dCas9 (Context 1), and delivered to either K562 or HEK293T cells (Context 2) at a low multiplicity of infection (MOI) such that the majority of cells express a single DBD-domain fusion. The target gene (inset) can be silenced or activated by recruitment of repressor or activator domains to the promoter. The synthetic reporters are integrated in the AAVS1 safe harbor and can be driven by different promoters (Context 3) and encode a synthetic surface marker (Igκ-hIgG1-Fc-PDGFRβ, purple) and fluorescent marker (Citrine, yellow). The endogenous target genes encode for surface markers (Context 3). After recruitment of Pfam domains, ON and OFF cells were magnetically separated using beads that bind these synthetic or endogenous surface markers, and the domains were sequenced in the Bound and Unbound populations to compute enrichments. B) Expression of synthetic reporters in K562 and HEK293T cells. The minimal reporter promoters, expected to be activatable, are minCMV, NTX, and NT21 and the stronger promoters, expected to be repressible, are pEF1α, PGK, UbC, and RSV. Positive control effectors, ZNF10 KRAB repressor or VP64 activator, were stably delivered by lentivirus. Cells were treated with 1000 ng/mL doxycycline for 5 days for repression and 2 days for activation (or untreated as a negative control) and Citrine expression was measured by flow cytometry after gating for rTetR delivery (mCherry + ) (n=2 infection replicates shown as curves). C) Expression of endogenous surface marker genes CD2 and CD43 in K562 cells measured by immunostaining and flow cytometry. dCas9 fusions and sgRNAs were delivered by lentivirus and selected for by blasticidin and puromycin, respectively. Data are gated for sgRNA delivery (mCherry + in CD43 and GFP + in CD2 samples) and for dCas9 (BFP + ) (n=1 infection replicate). D) Clustered heatmaps of transcriptional effector hits’ activation and silencing activity across different target gene, DBD, and cell-type recruitment contexts. To visualize a set of strong hits, a subset of effectors (columns) are shown that are a hit at a high threshold of 3 standard deviations stronger than the median of the poorly-expressed domains in ≥2 samples (rows) (n=143). Unbiased column clustering shows 3 major clusters of effectors that can be repressors, activators, or either depending on context (top). dCas9 targets pEF1α and minCMV with sgTetO-1, CD2 with sg717, and CD43 with sg10 (upper 2 rows) and sg15. Column labels on bottom show the protein, Pfam domain, and domain start position within the protein; select Pfam domain families are colored. Rows are manually ordered, with the targets that are predominantly repressible (strong reporters and CD43) above, and the predominantly activatable targets (minimal reporters and CD2) below. E) Distribution of the number of screen contexts in which a Pfam domain was a hit effector in two replicates. The percentage of domains that are shared hits in multiple contexts is colored.
Article Snippet: The following primary antibodies were used: allophycocyanin (APC)-labeled
Techniques: High Throughput Screening Assay, Binding Assay, Synthesized, Clone Assay, Infection, Marker, Expressing, Positive Control, Stable Transfection, Activation Assay, Negative Control, Flow Cytometry, Immunostaining, Activity Assay
Journal: bioRxiv
Article Title: Development of compact transcriptional effectors using high-throughput measurements in diverse contexts
doi: 10.1101/2023.05.12.540558
Figure Lengend Snippet: A . Schematics of recruitment constructs with rTetR (left) or dCas9 (right) as the DBD. These can be used to recruit effectors to either reporter constructs that are integrated into the AAVS1 safe harbor, or to endogenous genes. Safe sgRNAs target the genome at a safe location and the TetO sgRNA targets the synthetic reporter at an overlapping location as rTetR (the TetO motif upstream the promoter). B . Observation of background silencing at the RSV, PGK, and UbC promoters in K562 and HEK293T cells. Reporters were stably integrated at the AAVS1 safe harbor locus in both cell types by TALEN-mediated homology directed repair. C . Mean fluorescent intensity (MFI) of the Citrine reporter under different promoters: minCMV, NT21, NTX, PGK, UbC, pEF1α, PGK, and RSV. Each dot represents a mean taken from three replicates. Promoters with red text represent reporters that are OFF in both cell types. D . Testing CD43 TSS-targeting sgRNAs in K562 cells to identify guides that allow for analysis of KRAB-mediated silencing of the CD43 gene. Silencing was measured by CD43 surface marker immunostaining and flow cytometry 7 days after lentiviral sgRNA infection in stable dCas9-ZNF10 KRAB (blue) or dCas9-only (black) cell lines. Data is gated for sgRNA (mCherry + , only in samples with an sgRNA) and dCas9 (BFP + ) delivery (n=1 infection). E . dCas9-activators targeting CD2, CD20, CD28 surface marker genes in K562 cells. sgRNAs were stably installed by lentiviral delivery and puromycin selection. Then 500 ng of dCas9 plasmids were electroporated into 1e6 cells. Two days later, cells were stained for surface CD2 (APC), CD20 (APC), or CD28 (PE) expression and analyzed by flow cytometry after gating for dCas9 (BFP) and the stably expressed sgRNA (GFP) (n=1). F . Magnetic separation using anti-CD43 antibody and Protein G Dynabeads performed 9 days after lentiviral delivery of dCas9-Pfam library in K562 cells expressing sgRNAs that target CD43. Separation is measured by flow cytometry with gates for dCas9 (BFP + ) and sgRNA (mCherry + ). G . Overlap in hit Pfam domains in both biological replicates for HT-recruit screens, defined as elements that had ≥5 sequencing reads in Bound and Unbound and log 2 (OFF:ON) scores 2 standard deviations beyond (i.e. higher for repressors, lower for activators) the median of the poorly-expressed controls.
Article Snippet: The following primary antibodies were used: allophycocyanin (APC)-labeled
Techniques: Construct, Stable Transfection, Marker, Immunostaining, Flow Cytometry, Infection, Selection, Staining, Expressing, Sequencing

Journal: bioRxiv
Article Title: Development of compact transcriptional effectors using high-throughput measurements in diverse contexts
doi: 10.1101/2023.05.12.540558
Figure Lengend Snippet: A . Schematic of a library tiling all human chromatin regulator and transcription factor (CR & TF) proteins in 80 amino acid tiles with a 10 amino acid step size (n=128,565 elements) . This library was fused to dCas9 and used to target CD43 with sg15 and CD2 with sg717. B . Replicates of CR & TF library fused to dCas9 and recruited to CD43 or CD2 in K562 cells. Hit threshold shown at 2 standard deviations above (for CD43 screen) or below (CD2) the median of the random controls. Elements with >20 sequencing counts in both the Bound (ON) and Unbound (OFF) samples are included. The linear regression goodness of fits (R 2 ) are shown for all elements and for the subset that are hits in both replicates.
Article Snippet: The following primary antibodies were used: allophycocyanin (APC)-labeled
Techniques: Sequencing

Journal: bioRxiv
Article Title: Development of compact transcriptional effectors using high-throughput measurements in diverse contexts
doi: 10.1101/2023.05.12.540558
Figure Lengend Snippet: A ) HT-recruit with rTetR targeting two minimal promoters, minCMV and NTX in K562 cells (n=2 biological replicates). Dashed lines show hit thresholds at 2 standard deviations above the median of the poorly-expressed domains. Selected effectors are labeled with their gene name. B) Validation of activator domains across minimal promoter reporters in K562 cells. Individual rTetR-activator fusions or the rTetR-only negative control were delivered by lentivirus and, after selection, cells were treated with 1000 ng/ml doxycycline for 2 days to induce reporter activation. The percentage of cells activated was measured by flow cytometry for the Citrine reporter, after gating for delivery with mCherry. Bars show average percentage of cells ON normalized to no doxycycline control, error bars are standard deviation (n=3 infection replicates shown as dots). C) HT-recruit with dCas9 targeting endogenous gene CD2 with sg717 compared with rTetR targeting the minCMV reporter in K562 cells (n=2 biological replicates). Dashed lines show hit thresholds at 2 standard deviations above the median of the poorly-expressed domains. D) HT-recruit with rTetR targeting the minCMV reporter in K562 and HEK293T cells (n=2 biological replicates per cell type). Dashed lines show hit thresholds at 2 standard deviations above the median of the poorly-expressed domains. E) Individual rTetR fusions were delivered to minCMV reporter K562 or HEK293T cells by lentivirus, selected with blasticidin, and then recruitment was induced with 1000 ng/ml doxycycline for 2 days. Activation was measured by flow cytometry with a gate for rTetR delivery (mCherry + ). Bars show average percentage of cells ON normalized to no doxycycline control, error bars are standard deviation (n=2-3 infection replicates shown as dots). F) HTrecruit with dCas9 targeting endogenous gene CD43 with sg15 compared with rTetR targeting the pEF1α reporter in K562 cells (n=2 biological replicates). Dashed lines show hit thresholds at 2 standard deviations above the median of the poorlyexpressed domains. G) HT-recruit with dCas9 to activate the endogenous gene CD2 using sg717 compared with repression of pEF1α promoter with rTetR in K562 cells, showing only the HLH domains within the Pfam library (n=2 replicates per screen). Black line shows best linear fit. The conservative hit threshold (black dashed line) was chosen to identify robust effectors; some sub-threshold domains can have weaker repressor activity. The gray dashed vertical line is equivalent to the strength of the weakest repressor that was individually validated ( Methods ). The HLH phylogenetic groups are shown as colors ( ; ; ). H) rTetR recruitment to the pEF1α reporter in K562 cells. Shaded distributions show cells after 6 days of treatment with 1000 ng/ml of doxycycline while light gray curves show the untreated cells (n=2 infection replicates). I) dCas9 recruitment to CD2 in K562 cells (n=2 sgRNAs, sg717 in darker shade and sg718 in lighter shade). J) Full-length HLH TFs were defined as Activators (A, n=13), Repressors (R, n=25), both (A+R, n=17) or not yet defined (None, n=45) in previous studies, which were reviewed in . Colors show the fraction of HLH domains from the TFs within these categories that activate CD2 with dCas9, repress pEF1α with rTetR, or are dual-functioning.
Article Snippet: The following primary antibodies were used: allophycocyanin (APC)-labeled
Techniques: Labeling, Biomarker Discovery, Negative Control, Selection, Activation Assay, Flow Cytometry, Control, Standard Deviation, Infection, Activity Assay

Journal: bioRxiv
Article Title: Development of compact transcriptional effectors using high-throughput measurements in diverse contexts
doi: 10.1101/2023.05.12.540558
Figure Lengend Snippet: A . HT-recruit with rTetR targeting two minimal promoters, minCMV and NT21 in K562 cells (n=2 biological replicates). Dashed lines show hit thresholds at 2 standard deviations above the median of the poorly-expressed domains. B . Validation of SMARCA2 QLQ and CXXC1 and PYGO1 PHD activator domains across core promoter reporters (minCMV, NT21, NTX) in K562 cells. rTetR-activator fusions or the rTetR-only negative control were delivered by lentivirus to reporter cells. After selection, cells were treated with 1000 ng/ml doxycycline for 2 days to induce reporter activation. The percent of cells activated was measured by flow cytometry for the Citrine reporter, after gating for delivery with mCherry (n=3 replicates). C . HT-recruit with rTetR targeting the minCMV and background-silenced PGK reporters in HEK293T cells (n=2 biological replicates per promoter). rTetR-domain fusions were recruited to the reporter with 1000 ng/ml doxycycline for 2 days. The number of Pfam domains in each quadrant is labeled. D . Individual validations of activators across PGK and minCMV promoter types in HEK293T as measured by average percentage of cells ON normalized to no-doxycycline control. Cells were treated with 1000 ng/ml doxycycline for 2 days to induce reporter activation (n=2 independently transduced replicates for each promoter type). E . HT-recruit with dCas9 recruitment of activators with an sgRNA that binds the TetO site upstream the minCMV reporter in K562 cells (n=2 biological replicates). F . dCas9-activators recruited with an sgRNA that binds the TetO site upstream the minCMV reporter in K562 cells (n=2 infection replicates shown as dots). dCas9 fusions were delivered by lentivirus, selected with blasticidin starting on day 5, and cells were analyzed on day 9. Flow cytometry measurements were gated for dCas9 and TetO_sg1 using BFP and mCherry, respectively. Bars show mean and error bars show standard deviation. G . Other dCas9-activators recruited in K562 cells with sgRNA that binds the TetO site upstream the minCMV reporter (n=1 replicate). dCas9 fusions were delivered by lentivirus, selected with blasticidin starting on day 3, and cells were analyzed on day 9. Flow cytometry measurements were gated for dCas9 and TetO_sg1 using BFP and mCherry, respectively. H . Comparison of HT-recruit with the dCas9-Pfam domain library targeted to the CD2 gene TSS using two different guides (n=2 replicates for sg717 and n=1 for sg718) in K562 cells. Screen measurement was taken 10 days after library delivery. Schematic shows locations of the CD2-targeting guides (sg39 sg89, sg717, sg718, sg42) at the CD2 promoter region. I . Recruitment of dCas9-activator hits at the CD2 gene using two different guides (sg717 and sg718) in K562 cells. sgRNA were stably delivered by lentivirus and selected for with puromycin, then dCas9 fusion plasmids were delivered by electroporation, then cells were analyzed 3 days later by flow cytometry for surface stained CD2 after gating for dCas9 (BFP) and sgRNA (GFP). The percentage of cells ON is shown (n=1 replicate). The 80 AA sequences match the library elements while the trimmed sequences match the annotated Pfam domain. The polyQ is a homopolymer of 15 repeated glutamines, which is also found at the C-terminus of the 80 AA QLQ and is not present in the trimmed QLQ. bZIP_2 domain from CEBPE was filtered due to low counts in the screen. J . dCas9-HLHs were delivered to K562 cells by lentivirus and selected for with blasticidin, then sgRNAs were delivered by lentivirus and selected with puromycin, then 8 days after sgRNA delivery the cells were stained for the targeted surface markers and measured by flow cytometry. Data was gated for dCas9 with BFP and sgRNA with GFP. K . 9 days after lentiviral delivery of dCas9-fusions, K562 cells were immunostained with CD2 antibody to measure gene activation by flow cytometry (n=1). L . HT-recruit scores for activators that were hits in ≥5 samples across target, cell-type, and DBD contexts (n=2 replicates per rTetR screen and n=1-2 replicates per sgRNA for dCas9 screens shown as columns). The rows are clustered in an unbiased manner. mC=minCMV and P=PGK.
Article Snippet: The following primary antibodies were used: allophycocyanin (APC)-labeled
Techniques: Biomarker Discovery, Negative Control, Selection, Activation Assay, Flow Cytometry, Labeling, Control, Infection, Standard Deviation, Comparison, Stable Transfection, Electroporation, Staining

Journal: bioRxiv
Article Title: Development of compact transcriptional effectors using high-throughput measurements in diverse contexts
doi: 10.1101/2023.05.12.540558
Figure Lengend Snippet: A . dCas9 recruitment of CR & TF tiles to CD2 compared with rTetR recruitment to minCMV. Dashed lines show average of hit thresholds (n=2 replicates per screen). B . Proteins with activator hit tiles. Each horizontal line is a tile, and vertical bars show the range (n=2 screen replicates). Dashed horizontal line is the hit calling threshold based on random controls. Hit domains, defined as the sequence from the start of the first hit tile to the end of the last hit tile for a stretch of 1 or more consecutive hit tiles (that are below the hit threshold in both replicates), are shaded. UniProt annotations and Pfam domains are shown below. C . Overlap of hit activator domains from different contexts. Shared hits are defined as hit domains with any overlapping sequence. Proteins containing the top 6 strongest hit domains are listed, and for the shared hit category the proteins with the top 6 strongest CD2 activators are listed. D . Percentage of hit domains overlapping annotations. NR box motif is associated with recruitment of nuclear receptor coactivators . Some domains are hits in both contexts or overlap multiple annotations.
Article Snippet: The following primary antibodies were used: allophycocyanin (APC)-labeled
Techniques: Sequencing

Journal: bioRxiv
Article Title: Development of compact transcriptional effectors using high-throughput measurements in diverse contexts
doi: 10.1101/2023.05.12.540558
Figure Lengend Snippet: A . Individual validations of strong activator domains (FOXO3-TAD, LMSTEN, NCOA3, and ZNF473 KRAB which were previously validated in K562 cells ) at the minCMV reporter in HEK293T cells. rTetR(SE-G72P)-domain fusions were delivered to minCMV reporter cells by lentivirus and selected with blasticidin. Cells were treated with 1,000 ng/mL doxycycline for 2 days. Untreated cell distributions are shown in light gray and doxycycline-treated cells are shown in colors, with 2 biological replicates in each condition. The dotted vertical line shows the Citrine gate used to determine the fraction of cells ON. The average percentage of cells ON normalized to no doxycycline control is shown. VP64 and rTetR only were included as positive and negative controls, respectively. B . Individual validations of cell-type specific activator domains in HEK293T (top) and K562 (bottom) cells as also shown in . rTetR(SE-G72P)-domain fusions were delivered to minCMV reporter cells by lentivirus and selected with blasticidin. Cells were treated with 1,000 ng/mL doxycycline for 2 days, and then citrine reporter levels were measured by flow cytometry. Untreated cell distributions are shown in light gray and doxycycline-treated cells are shown in colors, with 3 replicates in each condition. The dotted vertical line shows the citrine gate used to determine the fraction of cells ON, and the average fraction ON for the doxycycline-treated cells is shown. C . Full set of individual validations of activator hits in K562 and HEK293T cells as measured by average percentage of cells ON normalized to no doxycycline control. Cells were treated with 1000 ng/ml doxycycline for 2 days to induce reporter activation (n=2-3 independently transduced replicates). K562-specific activators are shown as pink dots based on a 2σ hit threshold from the minCMV activator screen. D . minCMV reporter activation in K562 and HEK293T cells after 2 days of recruitment of SMARCA4 tiles overlapping the QLQ domain. The QLQ domain from SMARCA4 is not included in our Pfam domain library and shares ∼81% homology with SMARCA2 QLQ. Bars show mean and dots show 3 replicates. E . Left: Percentage of CD2 endogenous gene activated after transient expression and targeting of dCas9-effector fusions to the CD2 endogenous gene for 3 days in K562 cells using sg717 and sg718 guides. Cells were immunostained for CD2 (APC) expression and analyzed by flow cytometry after gating for dCas9 (TagBFP) and sgRNA (GFP). Each dot represents an independently transfected sgRNA (n=2-4). Right: Percentage of CD2 endogenous gene activated after transient expression and targeting of dCas9-domain fusions to the gene using multiple sgRNAs (sg39, sg42, sg717) for 3 days in HEK293Ts. Cells were immunostained for CD2 (APC) expression and analyzed by flow cytometry after gating for dCas9 (TagBFP) and sgRNA (GFP). Each dot represents an independently transfected biological replicate (n=2). dCas9 only and VPR are negative and positive controls, respectively. F . Activation of HEK293T minCMV reporter cells after 2 days of QLQ recruitment with doxycycline and SMARCA2/4 knockdown with co-transfected siRNA. Bars show mean and dots show 4 transfection replicates; asterisks show result of two-tailed Tukey’s test (Ctrl vs. SMARCA2: * p =0.040; SMARCA2 vs. SMARCA4: **** p = 1.3e-9; SMARCA4 vs. SMARCA2/4: **** p =3.2e-11). G . Activation of K562 and HEK293T minCMV reporter cells after 2 days of treatment with both doxycycline (to recruit SMARCA2 QLQ) and BRM014, a SMARCA2/4 ATPase inhibitor which reduces the levels of SMARCA2/4 in a chromatin fraction immunoprecipitation ( ; ). Bars show mean and dots show 2 replicates; asterisks show result of two-tailed unpaired t -test (K562: ** p =0.0025; HEK293T: *** p =0.0001). H . Activation of HEK293T cells after 2 days of treatment with both doxycycline and BRM014 when recruiting VP64 or FOXO3 FOXO-TAD. Bars show mean and dots show 2 replicates; asterisks show result of two-tailed unpaired t -test (VP64: ** p =0.0069; FOXO: *** p =0.0004).
Article Snippet: The following primary antibodies were used: allophycocyanin (APC)-labeled
Techniques: Control, Flow Cytometry, Activation Assay, Expressing, Transfection, Knockdown, Two Tailed Test, Immunoprecipitation

Journal: bioRxiv
Article Title: Development of compact transcriptional effectors using high-throughput measurements in diverse contexts
doi: 10.1101/2023.05.12.540558
Figure Lengend Snippet: A . HT-recruit with rTetR targeting the pEF1α promoter for 5 days and to the minCMV promoter for 2 days in K562 cells (n=2 biological replicates per reporter). Note the conservative hit threshold (black dashed line, 2 SD beyond median of poorly expressed domains), chosen to identify robust effectors, calls the strongest effects as hits; some sub-threshold domains might have weaker activity. The gray dashed vertical line shows a lower threshold, equivalent to the strength of the weakest repressor that was individually validated. B . HT-recruit with rTetR targeting the PGK promoter for 5 days and to the minCMV promoter for 2 days in K562 cells (n=2 biological replicates per reporter). C . HT-recruit with dCas9 targeting CD43 with sg15 and CD2 with sg717 in K562 cells (n=2 biological replicates per gene). The number of domains in each quadrant is labeled and the odds ratio (OR) and p-value from Fisher’s exact test is shown. D . HT-recruit with dCas9 to activate the endogenous gene CD2 using sg717 compared with repression of pEF1α promoter with rTetR in K562 cells (n=2 replicates per screen). Orange line shows best fit to data from HLH domains (shown in larger orange dots). Black dashed line shows conservative hit threshold; gray dashed vertical line shows lower threshold as in ( A ). E . Activating effector domains (FOXO3-TAD, SMARCA2 QLQ, MYB LMSTEN, NCOA3) fused to rTetR were stably integrated into K562 and HEK293T cells with lentivirus. Domains were recruited to the constitutive pEF1α reporter in both ce types for 5 days with doxycycline and then analyzed by flow cytometry for repression. Untreated cell distributions are shown in light gray and doxycycline-treated cells are shown in colors, with 3 biological replicates. The two dotted vertical line shows the Citrine gate used to determine the fraction of cells OFF and super-activated. rTetR only and ZNF10 KRAB were included as negative and positive repressor controls, respectively. F . Top: Quantification of data in ( D ). The normalized percentage of K562 or HEK293T cells OFF after recruitment at pEF1α with activating effector domains (n=3 biological replicates). Bottom: The normalized percentage of K562 or HEK293T cells super-activated to a higher ON state (n=3 biological replicates).
Article Snippet: The following primary antibodies were used: allophycocyanin (APC)-labeled
Techniques: Activity Assay, Labeling, Stable Transfection, Flow Cytometry

Journal: bioRxiv
Article Title: Development of compact transcriptional effectors using high-throughput measurements in diverse contexts
doi: 10.1101/2023.05.12.540558
Figure Lengend Snippet: A . Classification of HLH effector hits from the Pfam library screens at pEF with rTetR and CD2 with dCas9 in K562 cells. Hits are shown as colors and compared with phylogenetic grouping defined by ( ; ; ) and reported as used here in . For this analysis, an HLH domain is counted as repressing pEF if the average log 2 (OFF:ON) across biological replicates is above the lower threshold (>0.9, equivalent to the weakest individually validated repressor, Methods ). U=Unclassified. B . Comparison of dCas9 recruitment of the CRTF tiling ilbrary to CD2 and CD43. Dashed lines show hit thresholds at 2 standard deviations below or above the median of the random controls (n=2 replicates per screen). Some example hits are labeled with their protein. C . Comparison of dCas9 recruitment of the CRTF tiling ilbrary to CD2 with rTetR recruitment to pEF. Dashed lines show hit thresholds at 2 standard deviations below or above the median of the random controls (n=2 replicates per screen). Select hits are labeled with their protein, and the labels are orange for HLH proteins. D . Tiling HLH proteins. Each horizontal line is a tile, and vertical bars show the range (n=2 screen replicates). Orange lines show activation of CD2. Dashed horizontal line is the hit calling threshold. UniProt annotations and Pfam domains are shown below. The bHLH domains contain a short N-terminal basic DNA-binding region followed by an HLH heterodimerization region.
Article Snippet: The following primary antibodies were used: allophycocyanin (APC)-labeled
Techniques: Comparison, Labeling, Activation Assay, Binding Assay
![A ) HT-recruit scores for activators that were hits in ≥5 samples across target, cell-type, and DBD contexts (n=2 replicates per rTetR screen and n=1-2 replicates per sgRNA for dCas9 screens shown as columns). The rows are clustered in an unbiased manner. Labels for NCOA3 [1045-1092] (N), FOXO3 FOXO-TAD [604-644] (F), and ZNF473 KRAB [5-48] (Z) are colored. B) Size of N, Z, and F human activator domains and combinations compared to VP64 and VPR viral activators. C) The effectors were recruited with dCas9 to activate the endogenous CD2 surface marker in K562 cells. sgRNAs were delivered by lentivirus and cells were selected with puromycin, then dCas9 fusions were delivered by 10x concentrated lentivirus. 4 days after dCas9 delivery, cells were stained for CD2 and expression was measured by flow cytometry. On the left, CD2 expression is shown after gating cells for sgRNA delivery (GFP) and, on the right, after gating for both sgRNA and dCas9 delivery (BFP). The darker shaded histogram is CD2 sg717 and the lighter shade is sg718. D) Comparison of CD2 activation and dCas9-activator delivery (BFP), after gating for CD2 sg717 delivery (GFP + ). Color shows smoothed density of single cell flow cytometry data. The percentage of BFP + cells is labeled (n=2 infection replicates). E) Schematics of CRISPR activator systems using the NFZ tripartite activator fused to dCas9, dEnAsCas12a, or dCasMINI_V4. Np NLS=nucleoplasmin nuclear localization signal. F) dCas9-activator fusions targeting CD2, CD20, CD28 surface marker genes in K562 cells. sgRNAs were first installed by lentiviral delivery and puromycin selection. dCas9-activators were delivered by 5x concentrated lentivirus, 5 days later blasticidin selection was started, and then 4 days later cells were stained and analyzed by flow cytometry. Top: the percentage of cells ON (APC) is shown after gating for the sgRNA (GFP + ) and dCas9 (BFP + ). Note all of the VPR samples had <250 BFP + cells counted (associated with poor infection and survival of blasticidin selection), while all other samples had >6k BFP + cells (mean=53k). Bottom: the percentage of BFP + cells is shown. The CD28 sgRNAs infected with VPR poorly survived blasticidin selection and <300 cells total could be counted, so they are not shown. Each dot represents a different sgRNA targeting the gene (n=5-7 sgRNAs per effector). G) NFZ or VP64 were fused to dEnCas12a on a marker-less plasmid and co-electroporated into K562 cells with a CD2-targeting or safe-control gRNA expression plasmid with an mCherry marker. After 3 days, cells were stained for CD2 with APC-conjugated antibody and APC MFI was measured by flow cytometry after gating for high mCherry (n=2 replicates). H) NFZ or VPR were fused to dCasMINI on a plasmid with an mCherry marker and co-transfected into HEK293T GFP reporter cells with a TetO-targeting or non-targeting control gRNA expression plasmid with a BFP marker. 2 days later, GFP reporter activation was measured by flow cytometry with gates for BFP + /mCherry + cells (n=6 transfection replicates shown as dots, bar shows mean). I) Schematic of the minimized rapamycin-inducible transcription cassette using the ZFHD1 DBD fused to NFZ. J) Rapamycin-inducible expression of citrine with ZFHD1 recruitment of NFZ or a control activator combination, p65+HSF1. 3 ug of plasmids were transfected into HEK293T cells, one day later 10 nM rapamycin was added, and then two days later citrine mean fluorescence intensity (MFI) was measured by flow cytometry (n=2 transfection replicates shown as dots, bar shows mean). K) Rapamycin-inducible expression of HGF with ZFHD1 recruitment of NFZ, after transfection in HEK293T cells. Secreted HGF protein concentrations were measured in the cell culture supernatant by ELISA after 2 days of rapamycin treatment with varied doses. Transfection of no plasmid and a constitutive pEF1α-HGF plasmid served as a negative and positive control, respectively (n=2 transfection replicates, curve shows nonlinear regression fit to dose response data).](https://bio-rxiv-images-cdn.bioz.com/dois_ending_with_58/10__1101_slash_2023__05__12__540558/10__1101_slash_2023__05__12__540558___F4.large.jpg)
Journal: bioRxiv
Article Title: Development of compact transcriptional effectors using high-throughput measurements in diverse contexts
doi: 10.1101/2023.05.12.540558
Figure Lengend Snippet: A ) HT-recruit scores for activators that were hits in ≥5 samples across target, cell-type, and DBD contexts (n=2 replicates per rTetR screen and n=1-2 replicates per sgRNA for dCas9 screens shown as columns). The rows are clustered in an unbiased manner. Labels for NCOA3 [1045-1092] (N), FOXO3 FOXO-TAD [604-644] (F), and ZNF473 KRAB [5-48] (Z) are colored. B) Size of N, Z, and F human activator domains and combinations compared to VP64 and VPR viral activators. C) The effectors were recruited with dCas9 to activate the endogenous CD2 surface marker in K562 cells. sgRNAs were delivered by lentivirus and cells were selected with puromycin, then dCas9 fusions were delivered by 10x concentrated lentivirus. 4 days after dCas9 delivery, cells were stained for CD2 and expression was measured by flow cytometry. On the left, CD2 expression is shown after gating cells for sgRNA delivery (GFP) and, on the right, after gating for both sgRNA and dCas9 delivery (BFP). The darker shaded histogram is CD2 sg717 and the lighter shade is sg718. D) Comparison of CD2 activation and dCas9-activator delivery (BFP), after gating for CD2 sg717 delivery (GFP + ). Color shows smoothed density of single cell flow cytometry data. The percentage of BFP + cells is labeled (n=2 infection replicates). E) Schematics of CRISPR activator systems using the NFZ tripartite activator fused to dCas9, dEnAsCas12a, or dCasMINI_V4. Np NLS=nucleoplasmin nuclear localization signal. F) dCas9-activator fusions targeting CD2, CD20, CD28 surface marker genes in K562 cells. sgRNAs were first installed by lentiviral delivery and puromycin selection. dCas9-activators were delivered by 5x concentrated lentivirus, 5 days later blasticidin selection was started, and then 4 days later cells were stained and analyzed by flow cytometry. Top: the percentage of cells ON (APC) is shown after gating for the sgRNA (GFP + ) and dCas9 (BFP + ). Note all of the VPR samples had <250 BFP + cells counted (associated with poor infection and survival of blasticidin selection), while all other samples had >6k BFP + cells (mean=53k). Bottom: the percentage of BFP + cells is shown. The CD28 sgRNAs infected with VPR poorly survived blasticidin selection and <300 cells total could be counted, so they are not shown. Each dot represents a different sgRNA targeting the gene (n=5-7 sgRNAs per effector). G) NFZ or VP64 were fused to dEnCas12a on a marker-less plasmid and co-electroporated into K562 cells with a CD2-targeting or safe-control gRNA expression plasmid with an mCherry marker. After 3 days, cells were stained for CD2 with APC-conjugated antibody and APC MFI was measured by flow cytometry after gating for high mCherry (n=2 replicates). H) NFZ or VPR were fused to dCasMINI on a plasmid with an mCherry marker and co-transfected into HEK293T GFP reporter cells with a TetO-targeting or non-targeting control gRNA expression plasmid with a BFP marker. 2 days later, GFP reporter activation was measured by flow cytometry with gates for BFP + /mCherry + cells (n=6 transfection replicates shown as dots, bar shows mean). I) Schematic of the minimized rapamycin-inducible transcription cassette using the ZFHD1 DBD fused to NFZ. J) Rapamycin-inducible expression of citrine with ZFHD1 recruitment of NFZ or a control activator combination, p65+HSF1. 3 ug of plasmids were transfected into HEK293T cells, one day later 10 nM rapamycin was added, and then two days later citrine mean fluorescence intensity (MFI) was measured by flow cytometry (n=2 transfection replicates shown as dots, bar shows mean). K) Rapamycin-inducible expression of HGF with ZFHD1 recruitment of NFZ, after transfection in HEK293T cells. Secreted HGF protein concentrations were measured in the cell culture supernatant by ELISA after 2 days of rapamycin treatment with varied doses. Transfection of no plasmid and a constitutive pEF1α-HGF plasmid served as a negative and positive control, respectively (n=2 transfection replicates, curve shows nonlinear regression fit to dose response data).
Article Snippet: The following primary antibodies were used: allophycocyanin (APC)-labeled
Techniques: Marker, Staining, Expressing, Flow Cytometry, Comparison, Activation Assay, Labeling, Infection, CRISPR, Selection, Plasmid Preparation, Control, Transfection, Fluorescence, Cell Culture, Enzyme-linked Immunosorbent Assay, Positive Control

Journal: bioRxiv
Article Title: Development of compact transcriptional effectors using high-throughput measurements in diverse contexts
doi: 10.1101/2023.05.12.540558
Figure Lengend Snippet: A . dCas9-activator delivery to K562 cells by lentiviral infection. Flow cytometry measuring BFP delivery marker was performed 3 days after infection (n=8 infection replicates). * denotes p<0.0001 by unpaired t test for comparison of NFZ and VPR. B . 5x LentiX-concentrated lentivirus was used and cells were analyzed by flow cytometry at 3 timepoints. Blasticidin selection was initiated on day 5. Each dot is an independent infection (n=8 replicates per dCas9 construct). C . Lentiviral delivery to MCF10a breast cancer cells with 10x LentiX concentration, measured by flow cytometry after 4 days (n=1 replicate). D . Lentiviral delivery to J774 mouse macrophages with or without 4x LentiX concentration. 1e5 cells were infected with 1 mL of virus for 24 hours. Flow cytometry was performed 6 days after infection. BFP is a positive control lentivirus (pEF-PuroR-P2A-BFP). E . Activation of endogenous Cd2 in J774 after lentiviral sgRNA delivery (n=1 infection). Data is gated for sgRNA delivery (GFP + ) and for fair comparison, not gated for dCas9 delivery. Non-targeting (NT) sgRNAs are negative controls. F . Activation of endogenous Gpr84 or Actc1 measured by qPCR after lentiviral sgRNA delivery (n=1 infection). G . Optimization of the tripartite activator by changing the N, F, Z domains’ orientation. The various configurations were fused onto dCas9 and targeted to the CD2 gene in K562 cells. sgRNAs and then dCas9 fusions were delivered by unconcentrated lentivirus and selected with puromycin and blasticidin, respectively. Activation was measured 8 days after dCas9 infections by immunostaining CD2 with an APC-conjugated antibody followed by flow cytometry. The average percentage of cells ON is shown. The darker shaded histogram is CD2 sg717 and the lighter shade is sg718 (n=1 infection per sgRNA). dCas9-only and VP64 control data are shared with . H . dCas9-activators targeting CD2, CD20, CD28 surface marker genes in K562 cells. sgRNAs were stably installed by lentiviral delivery and puromycin selection. Then 500 ng of dCas9 plasmids were electroporated into 1e6 cells. Two days later, cells were stained for surface CD2 (APC), CD20 (APC), or CD28 (PE) expression and analyzed by flow cytometry after gating for dCas9 (BFP) and the stably expressed sgRNA (GFP). Each dot represents a different sgRNA targeting the gene (n=3-4 per gene). Control data are shared with . I . Percentage of CD2 endogenous gene activated 3 days after transient transfection of dCas9-activators and an sgRNA in HEK293T cells. Cells were immunostained for CD2 (APC) expression and analyzed by flow cytometry after gating for transfection (GFP on the sgRNA plasmid). Each dot represents an independently transfected biological replicate (n=2). J . dCas9-activator delivery 2 days after plasmid transfection in HEK293T cells measured by flow cytometry for the BFP marker on the dCas9-effector-T2A-BFP-P2A-BlastR transcript, with no gating on co-transfected delivery markers. dCas9-NFZ is significantly better delivered than dCas9-VPR with a greater fraction of BFP+ cells using a linear gate at 1.5e7 (P<0.05, two-tailed t-test). Each dot is an individual co-transfection of 500 ng of dCas9 plasmid and 300 ng of an sgRNA plasmid in a 24-well plate (n=11 transfection replicates for NFZ and VPR) or an untransfected negative control. Bar shows mean and error bars show standard deviation. K . BFP expression level in the same samples after accounting for overall delivery efficiencies by gating for transfectable cells based on the presence of GFP (from the co-transfected sgRNA plasmid). Each line is an individual co-transfection or the untransfected control and the black line shows the linear gate for BFP + cells. L . Fusion of SMARCA2 QLQ (Q) to dCas9-NZF. 9 days after lentiviral delivery of dCas9-activators, K562 cells were immunostained with CD2 antibody to measure gene activation by flow cytometry, and the average percentage of cells ON is shown. The darker shaded histogram is CD2 sg717 and the lighter shade is sg718. M . dCas9 recruitment of activators with an sgRNA that binds the TetO site upstream the minCMV reporter in K562 cells (n=2 infection replicates). dCas9 fusions were delivered by lentivirus and cells were analyzed 2, 5, and 9 days later with blasticidin selection starting at day 5. Flow cytometry measurements were gated for dCas9 and TetO_sg1 using BFP and mCherry, respectively (VPR measurements not shown due to having <100 BFP + cells). Control data are shared with . Bars show mean and error bars show standard deviation. N . dCas9-activators were delivered to K562 cells by lentivirus and selected for with blasticidin, then sgRNAs were delivered by lentivirus and selected for with puromycin, then 8 days after sgRNA delivery the cells were stained for the targeted surface marker genes and measured by flow cytometry. Surface marker expression is shown after gating for dCas9 with BFP and sgRNA with GFP, and dCas9-only data is shared with , which was performed in parallel. Top: the darker shaded histogram is CD2 sg42 and the lighter shade is sg46; middle: the darker shade is CD20 sg135 and the lighter shade is sg148; bottom: the darker shade is CD28 sg56 and the lighter shade is sg94. O . Homotypic combination of Q, N, Z, F activators fused onto dCas9 and delivered stably by lentivirus to target CD2 in K562 cell lines stably expressing the sgRNA. The mean fluorescence intensity (MFI) of CD2 staining (Alexa 647) of the cell population after gating for delivery of the sgRNA (GFP) and dCas9 fusion (BFP) is shown. Staining was performed 9 days after dCas9 fusion infection. Each point is an sgRNA (sg717 or sg718) and bars show the mean of two different sgRNAs.
Article Snippet: The following primary antibodies were used: allophycocyanin (APC)-labeled
Techniques: Infection, Flow Cytometry, Marker, Comparison, Selection, Construct, Concentration Assay, Virus, Positive Control, Activation Assay, Immunostaining, Control, Stable Transfection, Staining, Expressing, Transfection, Plasmid Preparation, Two Tailed Test, Cotransfection, Negative Control, Standard Deviation, Fluorescence

Journal: bioRxiv
Article Title: Development of compact transcriptional effectors using high-throughput measurements in diverse contexts
doi: 10.1101/2023.05.12.540558
Figure Lengend Snippet: A . NFZ and QNZF, or VP64 as a control, were fused to dCas12a. 1 ug of dCas12a plasmid and 1 ug of a CD2-targeting or safe-control gRNA expression plasmid with an mCherry marker was delivered to K562 cells by co-electroporation. After 3 days, cells were stained for CD2 with APC-conjugated antibody and activation was measured by flow cytometry. mCherry-APC bleedthrough compensation was applied and data was gated for high gRNA delivery (mCherry). Two replicates are shown as shaded histograms, and the mean percentage of CD2-targeted and activated cells is shown. B . dCas12a-only or dCas12a-activator fusions and then gRNAs were delivered to K562 cells by lentiviral infections. 8 days after the gRNA infection, cells were stained for HA and CD2 and activation was measured by flow cytometry. Data was gated for dCas12a (HA-tag) and gRNA delivery (mCherry). One replicate is shown and the percentage of CD2-targeted and activated cells is shown. C . dCas12a fusions were delivered to K562 cells by lentivirus. 5 days later, cells were split into blasticidin treatment or control wells. The percentage of viable cells was determined by flow cytometry 1 or 8 days later (n=1 replicate).
Article Snippet: The following primary antibodies were used: allophycocyanin (APC)-labeled
Techniques: Control, Plasmid Preparation, Expressing, Marker, Electroporation, Staining, Activation Assay, Flow Cytometry, Infection
Journal: Frontiers in pharmacology
Article Title: Exploration of the mechanism of Taohong Siwu Decoction for the treatment of ischemic stroke based on CCL2/CCR2 axis.
doi: 10.3389/fphar.2024.1428572
Figure Lengend Snippet: FIGURE 11 Expression of CD86 (M1) and CD206 (M2). (A): Expression of CD86 (M1); (B): Expression of CD206 (M2). #P < 0.05, ##P < 0.01 vs. sham; *p < 0.05, **p < 0.01 vs. MCAO/R.
Article Snippet: A11042), were both purchased from MultiSciences,
Techniques: Expressing
Journal: Cell reports
Article Title: A P53-Independent DNA Damage Response Suppresses Oncogenic Proliferation and Genome Instability
doi: 10.1016/j.celrep.2020.01.020
Figure Lengend Snippet: KEY RESOURCES TABLE
Article Snippet:
Techniques: Virus, Recombinant, Modification, Adhesive, Single Cell Gel Electrophoresis, TA Cloning, Sequencing, Generated, Software