|
Miltenyi Biotec
anti cd11b coated microbeads Anti Cd11b Coated Microbeads, supplied by Miltenyi Biotec, used in various techniques. Bioz Stars score: 96/100, based on 1 PubMed citations. ZERO BIAS - scores, article reviews, protocol conditions and more https://www.bioz.com/product/cd11b+microbead/CD11b+(Microglia)+MicroBeads%2C+human+and+mouse/pm41469672-83-4-7 Average 96 stars, based on 1 article reviews
anti cd11b coated microbeads - by Bioz Stars,
2026-10
96/100 stars
|
Buy from Supplier |
|
Miltenyi Biotec
cd11b magnabeads  Cd11b Magnabeads, supplied by Miltenyi Biotec, used in various techniques. Bioz Stars score: 96/100, based on 1 PubMed citations. ZERO BIAS - scores, article reviews, protocol conditions and more https://www.bioz.com/product/cd11b+microbead/CD11b+(Microglia)+MicroBeads%2C+human+and+mouse+-+small+size/pmc12519545-268-8-12 Average 96 stars, based on 1 article reviews
cd11b magnabeads - by Bioz Stars,
2026-10
96/100 stars
|
Buy from Supplier |
|
Miltenyi Biotec
cd11b microbeads  Cd11b Microbeads, supplied by Miltenyi Biotec, used in various techniques. Bioz Stars score: 96/100, based on 1 PubMed citations. ZERO BIAS - scores, article reviews, protocol conditions and more https://www.bioz.com/product/cd11b+microbead/CD11b+MicroBeads%2C+human+and+mouse+-+lyophilized/bio_rxiv__64898__2026__03__15__711858-82-17-20 Average 96 stars, based on 1 article reviews
cd11b microbeads - by Bioz Stars,
2026-10
96/100 stars
|
Buy from Supplier |
|
Miltenyi Biotec
nhp  Nhp, supplied by Miltenyi Biotec, used in various techniques. Bioz Stars score: 94/100, based on 1 PubMed citations. ZERO BIAS - scores, article reviews, protocol conditions and more https://www.bioz.com/product/cd11b+microbead/CD11b+MicroBeads%2C+non-human+primate/pmc10266791-229-5-8 Average 94 stars, based on 1 article reviews
nhp - by Bioz Stars,
2026-10
94/100 stars
|
Buy from Supplier |
|
Miltenyi Biotec
paramagnetic cd11b microbeads  Paramagnetic Cd11b Microbeads, supplied by Miltenyi Biotec, used in various techniques. Bioz Stars score: 96/100, based on 1 PubMed citations. ZERO BIAS - scores, article reviews, protocol conditions and more https://www.bioz.com/product/cd11b+microbead/CD11b+MicroBeads%2C+human+and+mouse/bio_rxiv__64898__2026__04__01__715652-206-26-29 Average 96 stars, based on 1 article reviews
paramagnetic cd11b microbeads - by Bioz Stars,
2026-10
96/100 stars
|
Buy from Supplier |
|
Miltenyi Biotec
anti mouse cd11b macs beads  Anti Mouse Cd11b Macs Beads, supplied by Miltenyi Biotec, used in various techniques. Bioz Stars score: 95/100, based on 1 PubMed citations. ZERO BIAS - scores, article reviews, protocol conditions and more https://www.bioz.com/product/cd11b+microbead/CD11b+MicroBeads+UltraPure%2C+mouse/bio_rxiv__2023__06__15__545113-208-5-9 Average 95 stars, based on 1 article reviews
anti mouse cd11b macs beads - by Bioz Stars,
2026-10
95/100 stars
|
Buy from Supplier |
|
Miltenyi Biotec
cd11b c microbeads Cd11b C Microbeads, supplied by Miltenyi Biotec, used in various techniques. Bioz Stars score: 93/100, based on 1 PubMed citations. ZERO BIAS - scores, article reviews, protocol conditions and more https://www.bioz.com/product/cd11b+microbead/CD11b%2Fc+(Microglia)+MicroBeads%2C+rat+-+small+size/pm42178562-264-9-12 Average 93 stars, based on 1 article reviews
cd11b c microbeads - by Bioz Stars,
2026-10
93/100 stars
|
Buy from Supplier |
Image Search Results
Journal: Disease Models & Mechanisms
Article Title: Interleukin-1 regulates myeloid cell trafficking and cerebral blood flow following intracerebral haemorrhage
doi: 10.1242/dmm.052306
Figure Lengend Snippet: Myeloid cells dominate the acute response to ICH and contribute to early damage. (A) Single cells were isolated from the right hemisphere of naïve, sham-operated and collagenase-induced ICH mice 24 h post-surgery and immunophenotyped using flow cytometry. (B) Left: gating strategy used during flow cytometry analysis. Right: cell counts are shown from the following populations: CD45 int CD11b + microglia, CD45 hi CD11b + Ly6G + neutrophils, CD45 hi CD11b + Ly6G − Ly6C hi monocytes (Mo), CD45 hi CD11b + Ly6G − Ly6C lo monocytes/macrophages (Mϕ), CD45 hi CD11b − CD45R + B cells, and CD45 hi CD11b − CD3 + T cells. Data presented as mean+s.e.m., n =5, two independent experiments. ns, not significant; * P <0.05; ** P <0.01; *** P <0.001, **** P <0.0001, determined by one-way ANOVA with Tukey's post-hoc test. (C) Formalin-fixed paraffin-embedded post-mortem human brain tissue from age- and region-matched control (left) and ICH (right) cases were immunostained for the myeloid cell marker CD11b (green) and DAPI (blue), with red blood cell (RBC) autofluorescence shown in red. One representative image from three cases per group shown. Scale bars: 100 µm (50 μm in insets). (D) White blood cells were isolated from whole blood of wild-type (WT) ( n =7) and chemokine receptor 2 ( Ccr2 ) −/− ( n =9) male littermate mice. Top left: CD115 + monocytes and Ly6G + neutrophils as a percentage of all CD45 + immune cells. Bottom left: representative flow plots of the circulating monocyte compartment of each genotype. Right: the amount of Ly6C hi monocytes as a percentage of total circulating monocytes from each genotype. ns, not significant; **** P <0.0001, determined by unpaired two-tailed t -test. (E) Following a 3 day training period on the rotarod assay, WT and Ccr2 −/− littermates were subjected to collagenase-induced ICH and tested on the rotarod again 24 h later. Data presented as net difference in latency to fall from baseline performance, n =7-9, four independent experiments. * P <0.05, determined by unpaired two-tailed t -test.
Article Snippet: Following single-cell isolation, myeloid cells were purified using
Techniques: Isolation, Flow Cytometry, Formalin-fixed Paraffin-Embedded, Control, Marker, Two Tailed Test

Journal: Disease Models & Mechanisms
Article Title: Interleukin-1 regulates myeloid cell trafficking and cerebral blood flow following intracerebral haemorrhage
doi: 10.1242/dmm.052306
Figure Lengend Snippet: IL-1 produced by mononuclear phagocytes controls acute recruitment of myeloid cells during ICH. (A) Mice were subjected to collagenase-induced ICH and culled at 4 h ( n =5) and 24 h ( n =4) post-ICH. 20 µm coronal brain sections were immunostained for either IL-1α (green, top row) or IL-1β (green, bottom row) together with Iba1 (red) and DAPI (blue). Dashed lines represent haematoma border, arrows define haematomal IL-1β+ cells, and insets are higher-magnification images of respective white boxes. Scale bars: 50 µm. (B) Quantification of IL-1 + cells. (C) 8 µm sections of formalin-fixed paraffin-embedded post-mortem human brain tissue from age- and region-matched control (top) and acute ICH (bottom) cases were immunostained for Iba1 (red), IL-1β (green) and DAPI (blue). Red blood cell (RBC) autofluorescence can be seen in white. One representative image from three patients per group is shown. Scale bars: 100 µm. Insets are higher-magnification images of the areas within the white boxes. (D) Representative flow plot of cells isolated from brains of mice injected with central (10 µg intrastriatal) and peripheral (100 mg kg −1 subcutaneous) IL-1 receptor antagonist (IL-1Ra) ( n =4) or placebo ( n =5) and subjected to ICH, two independent experiments. (E) Cell counts are shown from the following populations: CD45 hi CD11b − lymphocytes, CD45 int CD11b + microglia, CD45 hi CD11b + myeloid cells, CD45 hi CD11b + Ly6G + neutrophils, CD45 hi CD11b + Ly6G − Ly6C hi monocytes (Mo), CD45 hi CD11b + Ly6G − Ly6C lo monocytes/macrophages (Mϕ). Data presented as mean+s.e.m. ns, not significant; * P <0.05, ** P <0.01, *** P <0.001, determined by unpaired two-tailed t -test.
Article Snippet: Following single-cell isolation, myeloid cells were purified using
Techniques: Produced, Formalin-fixed Paraffin-Embedded, Control, Isolation, Injection, Two Tailed Test
Journal: bioRxiv
Article Title: Macrophage extracellular traps promote maladaptive cardiac remodelling and heart failure via PAD4-dependent mechanisms
doi: 10.64898/2026.03.15.711858
Figure Lengend Snippet: A , Schematic overview of the experimental design. WT-BMT and PAD4KO-BMT mice received either IgG isotype control or anti-Ly6G antibody (100 μg per mouse) by intraperitoneal injection every 3 days for 28 days, as indicated. B , Peripheral blood cell counts, and neutrophil and monocyte fractions (n=4-5). Neutrophils were determined by CD45 high Gr-1 high CD11b low and monocytes were determined by CD45 high Gr-1 low CD11b high by FACS analysis. C , Echocardiographic assessment 28 days after TAC (n=6 in each group). D , Representative fluorescent immunohistochemistry images of left ventricular tissue stained for neutrophil elastase (NE, green), citrullinated histone H3 (CitH3, red), and troponin I (yellow), with nuclear counterstaining by DAPI (blue). Arrowheads indicate NET-positive cells (NE + CitH3 + ). Scale bars, 50 μm. E , Quantification of the numbers of neutrophils (NE + ) and NETs (NE + CitH3 + ) per myocardial tissue area (n=4). F , Representative left ventricular sections stained for CD68 (green), CitH3 (red), troponin I (yellow) and DAPI (blue). Arrowheads indicate MET-positive cells (CD68 + CitH3 + ). Scale bars, 50 μm. G , Quantification of CD68 + macrophages and METs (CD68 + CitH3 + ) per tissue area (n=3-4). All data are presented as mean ± SEM. *P < 0.05 versus the corresponding IgG-treated group, † P < 0.05 versus IgG-treated WT-BMT mice, and ‡ P < 0.05 versus anti-Ly6G-treated WT-BMT mice as determined by one-way analysis of variance with Tukey’s post hoc analysis.
Article Snippet: Magnetic-activated cell sorting was performed on bone marrow cells using MACS MS columns (Miltenyi Biotec GmbH) with
Techniques: Control, Injection, Immunohistochemistry, Staining
Journal: The Journal of Clinical Investigation
Article Title: Brain microglia serve as a persistent HIV reservoir despite durable antiretroviral therapy
doi: 10.1172/JCI167417
Figure Lengend Snippet: ( A ) Brain tissue pieces were collected from the indicated brain regions and dissociated by mechanical disruption and enzymatic digestion. A CNS single-cell suspension was generated after Percoll separation. CD3 + T cells were positively selected and used for a CNS T cell QVOA. BrMCs and MG were isolated from the CD3 – fractions by CD11b + selection and by TMEM119 + selection, respectively. For human brains, CD11b + selection was performed to isolate BrMCs. BrMCs or MG at P0 (collected immediately after isolation) were used for purity and phenotype analysis and for RT-qPCR to measure proviral DNA and cell-associated RNA. BrMCs or MG at P1 were cultured 1–2 weeks ex vivo to allow the cells to recover and attach. P1 cells were used for the LRA study and the QVOA. ( B ) MG isolated from ART-suppressed, SIV-infected rhesus macaques were defined by TMEM119 staining (P1 MG) (scale bar: 100 μm) and ( C ) anti-TMEM119/anti-CD11b flow cytometry (P0 MG). ( D ) NHP MG proliferated ex vivo. ( E ) Total and integrated SIV DNA was detectable in isolated P0 MG ( n = 3). ( F ) SIV RNA was induced in isolated P1 MG 7 days after stimulation by the HDACi SAHA (500 nM), but was poorly induced by the canonical NF-κB agonist PEP005 (12 nM), the noncanonical NF-κB agonist AZD5582 (100 nM), or TNF-α (50 ng/mL). *** P < 0.001 compared with mock treatment, by 1-way ANOVA ( n = 3). ( G ) SIV RNA was recovered from the supernatant of NHP P1 MG cocultured with CEM174 ( n = 3). Data are presented as the mean ± SEM.
Article Snippet: For NHP samples, CD11b MicroBeads,
Techniques: Disruption, Suspension, Generated, Isolation, Selection, Quantitative RT-PCR, Cell Culture, Ex Vivo, Infection, Staining, Flow Cytometry
Journal: bioRxiv
Article Title: Atf3 Integrates Lipid and Cytoskeletal Remodeling to Drive Macrophage Fusion
doi: 10.64898/2026.04.01.715652
Figure Lengend Snippet: (A-B) Representative confocal micrographs of IL-4 stimulated BMDMs stained against the membrane-localized integrin CD11b show numerous DAPI-stained nuclei within a single control BMDM (A-A’’). In contrast, Atf3 KO BMDMs form multilayered aggregates, with mononuclear cells clearly separated by cell membranes (B-B’’). White arrowheads indicate the positions of the cross-sections. (C-D) 3D confocal projection of z-stack images of control (C) BMDMs stained for F-actin (Phal) after three days of IL-4 stimulation shows prominent ruffling (R), while Atf3 KO BMDMs display scarce thin filopodia (Fl, arrow). White arrowheads indicate the positions of the cross-sections, which are presented below (C’, D’). (E-F) Electron microscopy images highlight long filopodia in control BMDMs treated with IL-4 for three days (e), compared to the shorter projections in Atf3 KO cells (F). (G-J) Compared to the rich cortical actomyosin network in control cells, visualized by staining for F-actin (Phal) (G, H, corresponding intensity heatmaps G’, H’) and phospho-Myosin (S19), actomyosin cables in Atf3 KO BMDMs (I, J) are concentrated beneath the plasma membrane and extend along the branches. (K-L) Confocal micrographs of BMDMs expressing Lifeact-EGFP reveal actin-rich podosome rings (K, asterisks), lamellipodia (K, arrowhead) and filopodia (K, arrow) in control cells while these structures are notably reduced in Atf3 KO BMDMs (l). (M-O) Representative confocal micrographs (M, N) and quantification (O) of IL-4 stimulated BMDMs showing increased WASP fluorescence intensity in Atf3 KO macrophages (N) compared with control cells (M). In contrast to the primarily nuclear signal in control BMDMs, Atf3 KO BMDMs display WASP signal in both nucleus and cytoplasm. (P) Representative western blot of IL-4 treated cells shows marked decrease of F-actin in Atf3 KO BMDMs compared to control . (Q-R) Representative western blots of WASP, phospho-Cofilin (p-Cofilin) and total Cofilin protein levels (Q) and quantification (R) in IL-4-stimulated BMDMs of the indicated genotypes. ATP5α was used as a loading control. (S-T) Representative confocal micrographs reveal differential localization and enrichment of Filamin A (FLNA) in the nucleus (arrow, N) of control (S, S’) cells and in perinuclear foci (PN) of Atf3 KO (T, T’) BMDMs stimulated by IL-4. Data information: Data represent means ± s.d.; **p<0.01, ****p<0.0001 (O, R). Statistical significance was determined using Mann-Whitney test. Each dot represents individual cell from three independent experiments (O, n = 3) or individual animal (R, n = 8 left, n = 15 right) Micrographs are z-projections of multiple confocal sections. DAPI labels nuclei. Scale bars: 10 µm (A-D, G-L, S, T), 50 µm (M, N), and 0.5 µm (E, F).
Article Snippet: Peritoneal Macrophages (PMs) were isolated from the peritoneal cavity of 8-10-week-old mice according to a previously described protocol ( Herb et al , 2019 ) using
Techniques: Staining, Membrane, Control, Electron Microscopy, Clinical Proteomics, Expressing, Fluorescence, Western Blot, MANN-WHITNEY
Journal: bioRxiv
Article Title: Inhibition of Retinoic Acid Signaling in Proximal Tubular Epithelial cells Protects against Acute Kidney Injury by Enhancing Kim-1-dependent Efferocytosis
doi: 10.1101/2023.06.15.545113
Figure Lengend Snippet: PTEC DN-RAR mice underwent rhabdo or bilateral IRI-AKI, and kidneys harvested after 3 days. A-D, Increased F4/80 staining in the kidney after rhabdo- and IRI-AKI. A/B, F4/80 staining in uninjured mice (Ctrl) and after rhabdo-AKI (Rh-AKI). Area staining with F4/80 in the OSOM, and representative images showing F4/80, Sox9, and LTL staining. Left hand panels show F4/80 staining is largely restricted to the OSOM. Right hand panels show higher magnification of the OSOM. C/D, F4/80 staining after bilateral IRI-AKI. Quantification, and images showing F4/80 and LTL staining in the OSOM. Results expressed as means +/- SEM, individual data points shown. A/C, 1-way ANOVA, if p <0.05, q values shown for between group comparisons. Scale bars=100μM. E-F, Decreased expression of inflammatory markers in CD11B+ cells after IRI-AKI. PTEC DN-RAR mice underwent bilateral IRI-AKI, and bulk RNA seq performed on renal CD11B + cells 3 days after injury. E, Gene set enrichment analysis (GSEA) of downregulated genes using Gene Ontology (GO) datasets. F, GSEA for validated pro-inflammatory (“M1”), and anti-inflammatory (“M2”) gene sets in the RNA seq data. Set size=no. of genes from each gene set that are represented. NES=normalized expression score for the gene set sizes. G/H, Volcano plots showing fold change in expression of core enrichment gene from the CD11B+ bulk RNA seq dataset. Dotted line indicates p<0.05.
Article Snippet: Cells were then incubated with
Techniques: Staining, IF-P, Expressing, RNA Sequencing

Journal: bioRxiv
Article Title: Inhibition of Retinoic Acid Signaling in Proximal Tubular Epithelial cells Protects against Acute Kidney Injury by Enhancing Kim-1-dependent Efferocytosis
doi: 10.1101/2023.06.15.545113
Figure Lengend Snippet: PTEC DN-RAR mice underwent bilateral IRI-AKI, and bulk RNA seq was performed on CD11B + cells from 3 PEPCK Cre+ and 3 Cre- mouse kidneys 3 days after injury. PCA shows clear separation of Cre+ and Cre- datasets in the first dimension, which accounts for 57% of the variation.
Article Snippet: Cells were then incubated with
Techniques: RNA Sequencing

Journal: bioRxiv
Article Title: Inhibition of Retinoic Acid Signaling in Proximal Tubular Epithelial cells Protects against Acute Kidney Injury by Enhancing Kim-1-dependent Efferocytosis
doi: 10.1101/2023.06.15.545113
Figure Lengend Snippet: A, CD45 + cells: CD45 vs SSC-A; B, CD45 + single cells: FSC-H vs FSC-A, selected upper line followed by SSC-H vs. SSC-A select upper line; C, Single, CD45 + live cells: DAPI - vs. CD45 + ; D, Exclude CD45 + granulocytes: Ly6G + (granulocytes) and Ly6G - cells (non-granulocytes); E, F4/80 expression in CD11B + ; Ly6G - cells: F4/80 - ; Intermediate (int), 2); high (hi) (3); F-H, Ly6C expression: F, F4/80 - : Ly6C - (1), Int (2), high (3); G, F4/80 Int : Ly6C - (1), Int (2), high (3); H, F4/80 Hi : Ly6C - (1), Int (2), high (3); I-K, MHC-II expression: I, F4/80 - : MHC -- (1), Int (2), high (3); J, F4/80 Int : MHC-II - (1), Int (2), high (3); K, F4/80 Hi : MHC-II - (1), Int (2), high (3).
Article Snippet: Cells were then incubated with
Techniques: Expressing

Journal: bioRxiv
Article Title: Inhibition of Retinoic Acid Signaling in Proximal Tubular Epithelial cells Protects against Acute Kidney Injury by Enhancing Kim-1-dependent Efferocytosis
doi: 10.1101/2023.06.15.545113
Figure Lengend Snippet: Kidneys were harvested from 5 PEPCK Cre+ and 10 Cre- uninjured mice, and from 9 PEPCK Cre+ and 10 Cre- mice 3 days after bilateral IRI-AKI. Tissue was digested and homogenized and evaluated by flow cytometry using antibodies and gating strategy illustrated in . A, Total numbers of live, single CD45+ cells acquired; B, CD11B+ cells; and C, non-granulocytes (CD11B + ; Ly6G - ). Results expressed as means +/- SEM, with individual data points shown. 1-way ANOVA was used to compare between groups, and if p <0.05, q values shown for between group comparisons, corrected for repeated testing.
Article Snippet: Cells were then incubated with
Techniques: Flow Cytometry, IF-P

Journal: bioRxiv
Article Title: Inhibition of Retinoic Acid Signaling in Proximal Tubular Epithelial cells Protects against Acute Kidney Injury by Enhancing Kim-1-dependent Efferocytosis
doi: 10.1101/2023.06.15.545113
Figure Lengend Snippet: Kidneys were harvested from PTEC DN RAR mice 3 days after bilateral IRI-AKI. Tissue was digested, homogenized, and evaluated by flow cytometry. A/B, F4/80 hi cells (kidney resident macrophages). A, F4/80 hi cells as the % of gated CD11B + CD45 + Ly6G - cells. B, CD11B and F4/80 expression charts in PEPCK Cre+ and Cre- mice after IRI-AKI (% in gated area indicated with *). C-F, Ly6C hi cells (inflammatory monocyte/macrophages) . C, F4/80 - (infiltrating monocytes) Ly6C hi cells, and E, F4/80 int (bone marrow derived macrophages) Ly6C hi cells, as the % of gated F4/80 - and F4/80 int cells, respectively. D/F, CD11B and Ly6C expression charts. G/H, CD206/mannose receptor expression (an M2 activated macrophage marker) . G, CD206 + cells as the % of gated F4/80 hi cells. H, CD11B and CD206 expression charts. Results are expressed as means +/- SEM, with individual datapoints shown. 1-way ANOVA was used to compare between groups, and if p <0.05, q values shown for between group comparisons, corrected for repeated testing.
Article Snippet: Cells were then incubated with
Techniques: Flow Cytometry, Expressing, Derivative Assay, Marker, IF-P
Journal: bioRxiv
Article Title: Inhibition of Retinoic Acid Signaling in Proximal Tubular Epithelial cells Protects against Acute Kidney Injury by Enhancing Kim-1-dependent Efferocytosis
doi: 10.1101/2023.06.15.545113
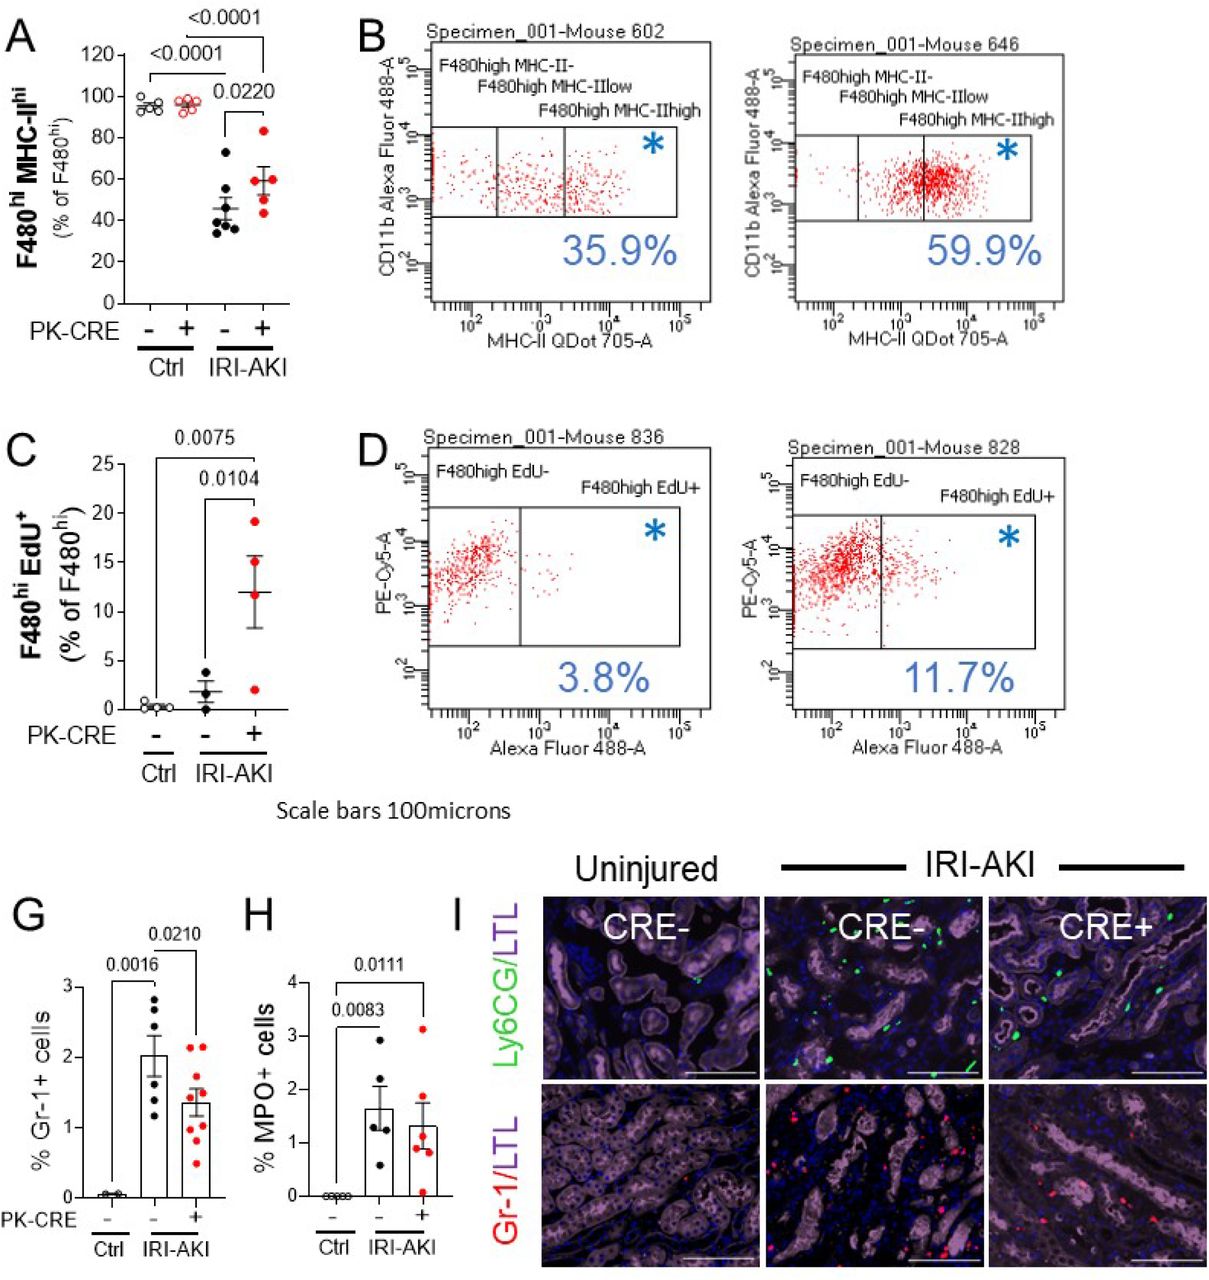
Figure Lengend Snippet: Kidneys were harvested from PTEC DN RAR mice, uninjured and 3 days after bilateral IRI AKI. Tissue was digested, homogenized, and evaluated by flow cytometry. A/B, MHC-II hi F4/80 hi cells (kidney resident macrophages). A, MHC-II hi as the % of gated F4/80 hi cells. B, Representative CD11B and MHC-II expression chart in PEPCK Cre+ and Cre- mice after IRI-AKI (% in gated area indicated with *). C/D, EdU + F4/80 hi cells (proliferating kidney resident macrophages). C, EdU labeled cells as the % of gated F4/80 hi cells. D, Representative CD11B (Y axis) and EdU (X-axis) staining charts. E/F, Immunofluorescence staining with monocyte and neutrophil markers, Gr-1 and MPO. Kidneys were harvested from PTEC DN RAR mice 3 days after bilateral IRI-AKI and co-labeled with LTL and either Gr-1 (a marker of activated monocytes and neutrophils), or MPO (a marker of neutrophils) antibodies. G/H, G, Quantification of the Gr-1 and MPO+ cells as the % of the total cells counted. Results are expressed as means +/- SEM, with individual datapoints shown. 1-way ANOVA used to compare between groups, and if p <0.05, q values shown for between group comparisons, corrected for repeated testing.
Article Snippet: Cells were then incubated with
Techniques: Flow Cytometry, Expressing, Labeling, Staining, Immunofluorescence, Marker, IF-P