|
New England Biolabs
cas9 protein Cas9 Protein, supplied by New England Biolabs, used in various techniques. Bioz Stars score: 99/100, based on 1 PubMed citations. ZERO BIAS - scores, article reviews, protocol conditions and more https://www.bioz.com/product/cas9/EnGen+Spy+Cas9+NLS/pm41957360-212-23-25 Average 99 stars, based on 1 article reviews
cas9 protein - by Bioz Stars,
2026-10
99/100 stars
|
Buy from Supplier |
|
Novus Biologicals
anti cas9 Anti Cas9, supplied by Novus Biologicals, used in various techniques. Bioz Stars score: 91/100, based on 1 PubMed citations. ZERO BIAS - scores, article reviews, protocol conditions and more https://www.bioz.com/product/cas9/CRISPR-Cas9+Antibody+(SR1104)/pmc08783129-461-0-6 Average 91 stars, based on 1 article reviews
anti cas9 - by Bioz Stars,
2026-10
91/100 stars
|
Buy from Supplier |
|
Danaher Inc
nucleotide protospacer sequence crrna Nucleotide Protospacer Sequence Crrna, supplied by Danaher Inc, used in various techniques. Bioz Stars score: 95/100, based on 1 PubMed citations. ZERO BIAS - scores, article reviews, protocol conditions and more https://www.bioz.com/product/cas9/Alt-R+CRISPR-Cas9+Negative+Control+crRNA/bio_rxiv__2023__05__05__539557-335-2-6 Average 95 stars, based on 1 article reviews
nucleotide protospacer sequence crrna - by Bioz Stars,
2026-10
95/100 stars
|
Buy from Supplier |
|
Danaher Inc
recombinant cas9 nuclease  Recombinant Cas9 Nuclease, supplied by Danaher Inc, used in various techniques. Bioz Stars score: 96/100, based on 1 PubMed citations. ZERO BIAS - scores, article reviews, protocol conditions and more https://www.bioz.com/product/cas9/Alt-R+S%2Ep%2E+Cas9+Nuclease+V3/bio_rxiv__2023__03__28__534511-188-16-24 Average 96 stars, based on 1 article reviews
recombinant cas9 nuclease - by Bioz Stars,
2026-10
96/100 stars
|
Buy from Supplier |
|
Danaher Inc
electroporation enhancer Electroporation Enhancer, supplied by Danaher Inc, used in various techniques. Bioz Stars score: 95/100, based on 1 PubMed citations. ZERO BIAS - scores, article reviews, protocol conditions and more https://www.bioz.com/product/cas9/Alt-R+Cas9+Electroporation+Enhancer/bio_rxiv__2023__06__17__545406-162-7-13 Average 95 stars, based on 1 article reviews
electroporation enhancer - by Bioz Stars,
2026-10
95/100 stars
|
Buy from Supplier |
|
Danaher Inc
crispr cas9 nuclease Crispr Cas9 Nuclease, supplied by Danaher Inc, used in various techniques. Bioz Stars score: 93/100, based on 1 PubMed citations. ZERO BIAS - scores, article reviews, protocol conditions and more https://www.bioz.com/product/cas9/SpyFi+Cas9+Nuclease/pmc08113199-34-9-11 Average 93 stars, based on 1 article reviews
crispr cas9 nuclease - by Bioz Stars,
2026-10
93/100 stars
|
Buy from Supplier |
|
Danaher Inc
alt r crispr cas9 crrna targeting crebbp exon 26  Alt R Crispr Cas9 Crrna Targeting Crebbp Exon 26, supplied by Danaher Inc, used in various techniques. Bioz Stars score: 95/100, based on 1 PubMed citations. ZERO BIAS - scores, article reviews, protocol conditions and more https://www.bioz.com/product/cas9/CRISPR-Cas9+crRNA/bio_rxiv__2023__02__13__528351-321-11-8 Average 95 stars, based on 1 article reviews
alt r crispr cas9 crrna targeting crebbp exon 26 - by Bioz Stars,
2026-10
95/100 stars
|
Buy from Supplier |
|
OriGene
cas9 mrna  Cas9 Mrna, supplied by OriGene, used in various techniques. Bioz Stars score: 90/100, based on 1 PubMed citations. ZERO BIAS - scores, article reviews, protocol conditions and more https://www.bioz.com/product/cas9/Cas9+mRNA/pmc06423417-203-3-10 Average 90 stars, based on 1 article reviews
cas9 mrna - by Bioz Stars,
2026-10
90/100 stars
|
Buy from Supplier |
|
OriGene
cas9  Cas9, supplied by OriGene, used in various techniques. Bioz Stars score: 90/100, based on 1 PubMed citations. ZERO BIAS - scores, article reviews, protocol conditions and more https://www.bioz.com/product/cas9/CAS9+Rabbit+Polyclonal+Antibody/pm32319578-103-31-39 Average 90 stars, based on 1 article reviews
cas9 - by Bioz Stars,
2026-10
90/100 stars
|
Buy from Supplier |
|
Novus Biologicals
nbp2 36440 Nbp2 36440, supplied by Novus Biologicals, used in various techniques. Bioz Stars score: 93/100, based on 1 PubMed citations. ZERO BIAS - scores, article reviews, protocol conditions and more https://www.bioz.com/product/cas9/CRISPR-Cas9+Antibody+(7A9-3A3)+-+N-Terminus+-+BSA+Free/med_rxiv__64898__2026__04__09__26350488-266-16-17 Average 93 stars, based on 1 article reviews
nbp2 36440 - by Bioz Stars,
2026-10
93/100 stars
|
Buy from Supplier |
|
Addgene inc
icas9 page 16 39 paavs1 tre cas9 puro polya cag rtta Icas9 Page 16 39 Paavs1 Tre Cas9 Puro Polya Cag Rtta, supplied by Addgene inc, used in various techniques. Bioz Stars score: 93/100, based on 1 PubMed citations. ZERO BIAS - scores, article reviews, protocol conditions and more https://www.bioz.com/product/cas9/pAAVS1-TRE-Cas9-+puro-polyA-CAG-rtTA+(Plasmid+%23107270)/ppr0783132-252-5-9 Average 93 stars, based on 1 article reviews
icas9 page 16 39 paavs1 tre cas9 puro polya cag rtta - by Bioz Stars,
2026-10
93/100 stars
|
Buy from Supplier |
|
Addgene inc
pet cas9 nls  Pet Cas9 Nls, supplied by Addgene inc, used in various techniques. Bioz Stars score: 93/100, based on 1 PubMed citations. ZERO BIAS - scores, article reviews, protocol conditions and more https://www.bioz.com/product/cas9/pET-Cas9-NLS-6xHis+(Plasmid+%2362933)/pm40030016-339-22-28 Average 93 stars, based on 1 article reviews
pet cas9 nls - by Bioz Stars,
2026-10
93/100 stars
|
Buy from Supplier |
Image Search Results
Journal: bioRxiv
Article Title: TET2 lesions enhance the aggressiveness of CEBPA- mutant AML by rebalancing GATA2 expression
doi: 10.1101/2023.03.28.534511
Figure Lengend Snippet: ( A ) Schematic representation of generation of Tet2 -knockout clones with CRISPR/Cas9. ( B ) Proliferative outgrowth of Cebpa p30/p30 cells with Tet2 indels. ( C ) Volcano plot depicting differentially expressed genes dependent on the Tet2 mutational status in Cebpa p30/p30 cells (n=5–7 per group). ( D ) Experimental setup for evaluating the effect of Tet2 -deficiency ( Tet2 −/− ) in Cebpa DM AML initiation in vivo . ( E ) Myeloid (Mac1 + ) contribution of donor-derived blood and bone marrow (BM) cells evaluated at 12, 24, and 36 weeks after BM transplantation and Cre-LoxP recombination to generate a Cebpa −/p30 and Tet2 −/− hematopoietic compartment (n=3–6 per genotype and timepoint). ( F ) Survival of lethally irradiated recipient mice after BM transplantation and Cre-LoxP recombination (n=12–14/group). ( G ) Volcano plot depicting differentially expressed genes dependent on Tet2 deficiency status in Cebpa −/p30 leukemic blasts (n=3 per group). ( H ) Frequency of proliferating (Ki67 + ) cells in BM of moribund recipient mice (n=3 per group). **=P<0.01, ***=P<0.001, ****=P<0.0001
Article Snippet: For generation of Tet2 or Gata2 mutated clones, Cebpa p30/p30 cells were electroporated with ribonucleoparticles containing
Techniques: Knock-Out, Clone Assay, CRISPR, In Vivo, Derivative Assay, Transplantation Assay, Irradiation

Journal: bioRxiv
Article Title: TET2 lesions enhance the aggressiveness of CEBPA- mutant AML by rebalancing GATA2 expression
doi: 10.1101/2023.03.28.534511
Figure Lengend Snippet: ( A ) Experimental setup for evaluating the effect of Gata2 knockdown, via short hairpin RNA (shRNA) mediated silencing, on Cebpa p30/p30 leukemic cells in a competitive in vivo assay. ( B ) Gata2 mRNA in Cebpa p30/p30 leukemic cells prior to transplantation. ( C ) Representative flow cytometry profiles of input and output of shControl (no knockdown), sh Gata2 A (low knockdown), and sh Gata2 D (high knockdown). ( D ) Competitive advantage of targeting shRNA (GFP + ) vs. non-targeting shRNA (YFP + ) cells in vivo assessed as by flow cytometry (n=3–4 per group). ( E ) Experimental setup for Gata2 CRISPR/Cas9 mutagenesis in Cebpa p30/p30 cells, and outgrowth of heterozygous mutated clones. Percentages of Gata2 mutated clones are indicated. ( F ) Growth curve of Cebpa p30/p30 clones with Gata2 mutation ( Cebpa p30/p30 Gata2 +/MUT ) or wild type Gata2 ( Cebpa p30/p30 Gata2 +/+ ). Red lines mark individual clones. (G) Presence or absence of GATA2 mutations ( GATA2 MUT ) in CEBPA double mutated ( CEBPA DM ) AML cases (n=460) with or without TET2 mutations ( TET2 MUT ) in aggregated data from published cohorts – , , , . *=P<0.05, **=P<0.01
Article Snippet: For generation of Tet2 or Gata2 mutated clones, Cebpa p30/p30 cells were electroporated with ribonucleoparticles containing
Techniques: Knockdown, shRNA, In Vivo, Transplantation Assay, Flow Cytometry, CRISPR, Mutagenesis, Clone Assay

Journal: bioRxiv
Article Title: TET2 lesions enhance the aggressiveness of CEBPA- mutant AML by rebalancing GATA2 expression
doi: 10.1101/2023.03.28.534511
Figure Lengend Snippet: ( A ) Gata2 mRNA expression in mouse Cebpa p30/p30 leukemic granulocyte/monocyte progenitors (GMPs) vs normal GMPs and, ( B ) CEBPA binding to the Gata2 distal hematopoietic enhancer ( G2 DHE; −77kb) region, data from Jakobsen et al. (n=2–4 per group). ( C ) Schematic genomic view of the Gata2 distal hemeatopoietic enhancer ( G2 DHE), including tracks from CEBPA and H3K27Ac chromatin immunoprecipitation sequencing (ChIP-seq) in Cebpa p /p30 cells (data from Heyes et al. ), TET2 ChIP-seq in AML-ETO expressing cells (data from Rasmussen et al. ),Targeting of the G2 DHE by dual-( D ) or single-( E ) guided CRISPR-Cas9 in Cebpa p30/p30 cells using indicated sgRNAs (n=3/condition). ( F ) Experimental setup for evaluating the effects of Cebpa knockout on Gata2 V2 mRNA expression and DNA methylation of the CpG island at the promoter of Gata2 V2 in MLL-fusion driven AML ( iMLL-AF9 ). ( G ) Cebpa and ( H ) Gata2 V2 mRNA expression upon induction of Cre-LoxP recombination and, ( I ) DNA methylation of the Gata2 V2 promoter CpG-island (2 biological replicates per genotype). ( J ) Frequency of GATA2 and/or TET2 mutations ( GATA2 MUT and TET2 MUT , respectively) in CEBPA high expressing ( CEBPA HIGH n=45) vs. CEBPA low expressing (CEBPA LOW n=61) AML cases, data from Beat AML cohort . *=P<0.05, **=P<0.01, ***=P<0.001, ****=P<0.0001
Article Snippet: For generation of Tet2 or Gata2 mutated clones, Cebpa p30/p30 cells were electroporated with ribonucleoparticles containing
Techniques: Expressing, Binding Assay, ChIP-sequencing, CRISPR, Knock-Out, DNA Methylation Assay
Journal: bioRxiv
Article Title: Cooperative super-enhancer inactivation caused by heterozygous loss of CREBBP and KMT2D skews B cell fate decisions and yields T cell-depleted lymphomas
doi: 10.1101/2023.02.13.528351
Figure Lengend Snippet: A , Odds ratio (OR) analysis of CREBBP and KMT2D mutations among EZB/Cluster3 DLBCL (n=319) and FL_all (merged FL datasets, n=478) cohorts of patients. The p values were calculated by Fisher’s exact test. B , Representative H&E and B220 IHC images of formalin-fixed paraffin-embedded kidney and liver sections prepared from mice euthanized at day 116 post-BMT. The scale bars represent 380 pixels. C , Representative H&E, B220 and Ki67 IHC images of formalin-fixed paraffin-embedded spleen sections from mice euthanized at day 235 post-BMT. The scale bars represent 200 pixels. D , Representative FACS plots show the gating strategy and frequency of B220 + CD38 - FAS + splenic GC B cells in mice at day 235 post-BMT. E , FACS analysis showing the relative abundance of splenic total B cells (B220 + ) normalized to total single cells at day 116 and 235 post-BMT (mean ± SD). Each dot represents a mouse (n=4 mice per genotype).
Article Snippet: HiFi Cas9 Nuclease (IDT; 1081061), Alt-R CRISPR-Cas9 tracrRNA (
Techniques: Formalin-fixed Paraffin-Embedded
Journal: bioRxiv
Article Title: Cooperative super-enhancer inactivation caused by heterozygous loss of CREBBP and KMT2D skews B cell fate decisions and yields T cell-depleted lymphomas
doi: 10.1101/2023.02.13.528351
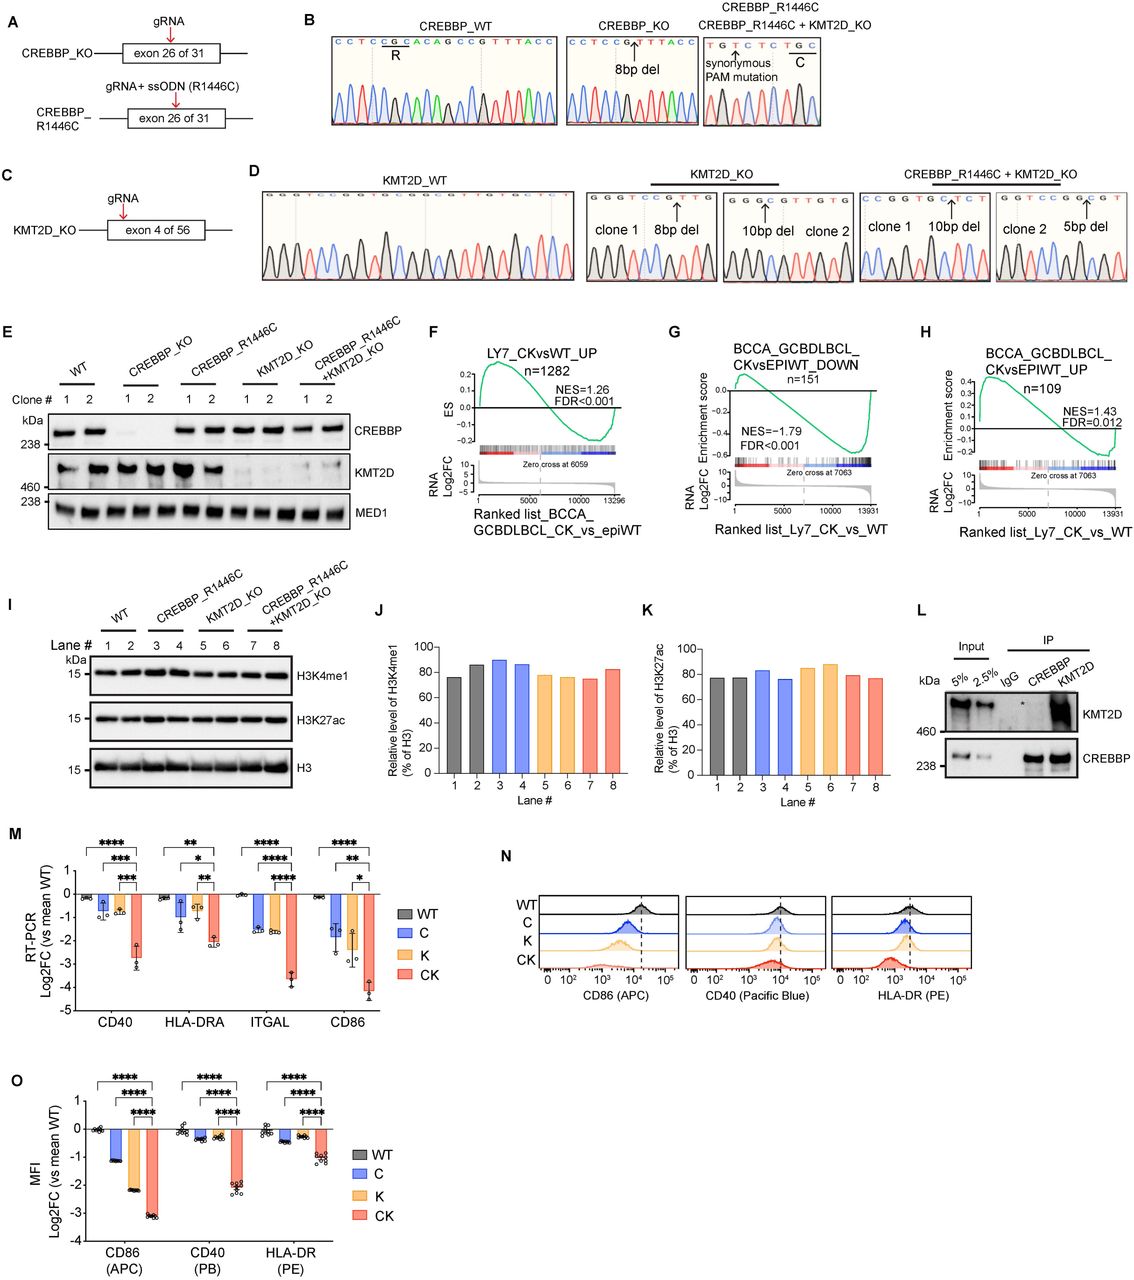
Figure Lengend Snippet: A , Experimental design for generating CREBBP -KO and CREBBP -R1446C, an enzymatically dead mutant, OCI-Ly7 cell lines. ssODN: single-stranded oligodeoxynucleotide. B , Sanger sequencing chromatogram confirming the homozygous knock out or R1446C point mutation in CREBBP . C , Experimental design for generating KMT2D -KO OCI-Ly7 cell line. D , Sanger sequencing chromatogram confirming the homozygous knock out of KMT2D . E , Immunoblotting for endogenous CREBBP and KMT2D in the indicated isogenic OCI-Ly7 cell lines using MED1 as internal loading control. F , GSEA plot using CK vs WT upregulated genes in OCI-Ly7 as the gene set against a ranked gene list based on CK vs epigenetic WT RNA-seq datasets of human BCCA cohort GCB-DLBCL patients. NES, normalized enrichment score. The p value was calculated by an empirical phenotype-based permutation test. The FDR is adjusted for gene set size and multiple hypotheses testing. G-H , GSEA plots using CK vs epigenetic WT ( G ) downregulated or ( H ) upregulated genes in human BCCA cohort GCB-DLBCL patients as the gene set against a ranked gene list based on CK vs WT OCI-Ly7 RNA-seq datasets. NES, normalized enrichment score. The p value was calculated by an empirical phenotype-based permutation test. The FDR is adjusted for gene set size and multiple hypotheses testing. I , Immunoblot for H3K4me1, H3K27ac and H3 in isogenic OCI-Ly7 cells. J-K , Relative densitometry of ( J ) H3K4me1 and ( K ) H3K27ac for panel I . L , Co-IP for assessing interaction between endogenous CREBBP and KMT2D in human SUDHL4 GCB-DLBCL cell line. M , RT-qPCR of indicated genes in different isogenic OCI-Ly7 cells. qPCR signal for each gene was normalized to those of HPRT and then mean WT and presented as log2 fold-change ± SEM. Statistical significance was determined using ordinary one-way ANOVA followed by Tukey-Kramer’s multiple comparisons test (**p < 0.01, ***p < 0.001, ****p < 0.0001). N , Stacked flow cytometry histograms showing the progressive signal decrease for the indicated surface markers in C, K, and CK-deficient OCI-Ly7 cells compared to WT. O , FACS measuring cell surface levels of the indicated markers in different isogenic OCI-Ly7 cells. Mean fluorescence intensity (MFI) of each surface marker was normalized to mean WT and presented as log2 fold-change ± SEM. Each dot represents a biological replicate. Statistical significance was determined using ordinary one-way ANOVA followed by Tukey-Kramer’s multiple comparisons test (****p < 0.0001).
Article Snippet: HiFi Cas9 Nuclease (IDT; 1081061), Alt-R CRISPR-Cas9 tracrRNA (
Techniques: Mutagenesis, Sequencing, Knock-Out, Western Blot, Control, RNA Sequencing, Co-Immunoprecipitation Assay, Quantitative RT-PCR, Flow Cytometry, Fluorescence, Marker
Journal: bioRxiv
Article Title: Cooperative super-enhancer inactivation caused by heterozygous loss of CREBBP and KMT2D skews B cell fate decisions and yields T cell-depleted lymphomas
doi: 10.1101/2023.02.13.528351
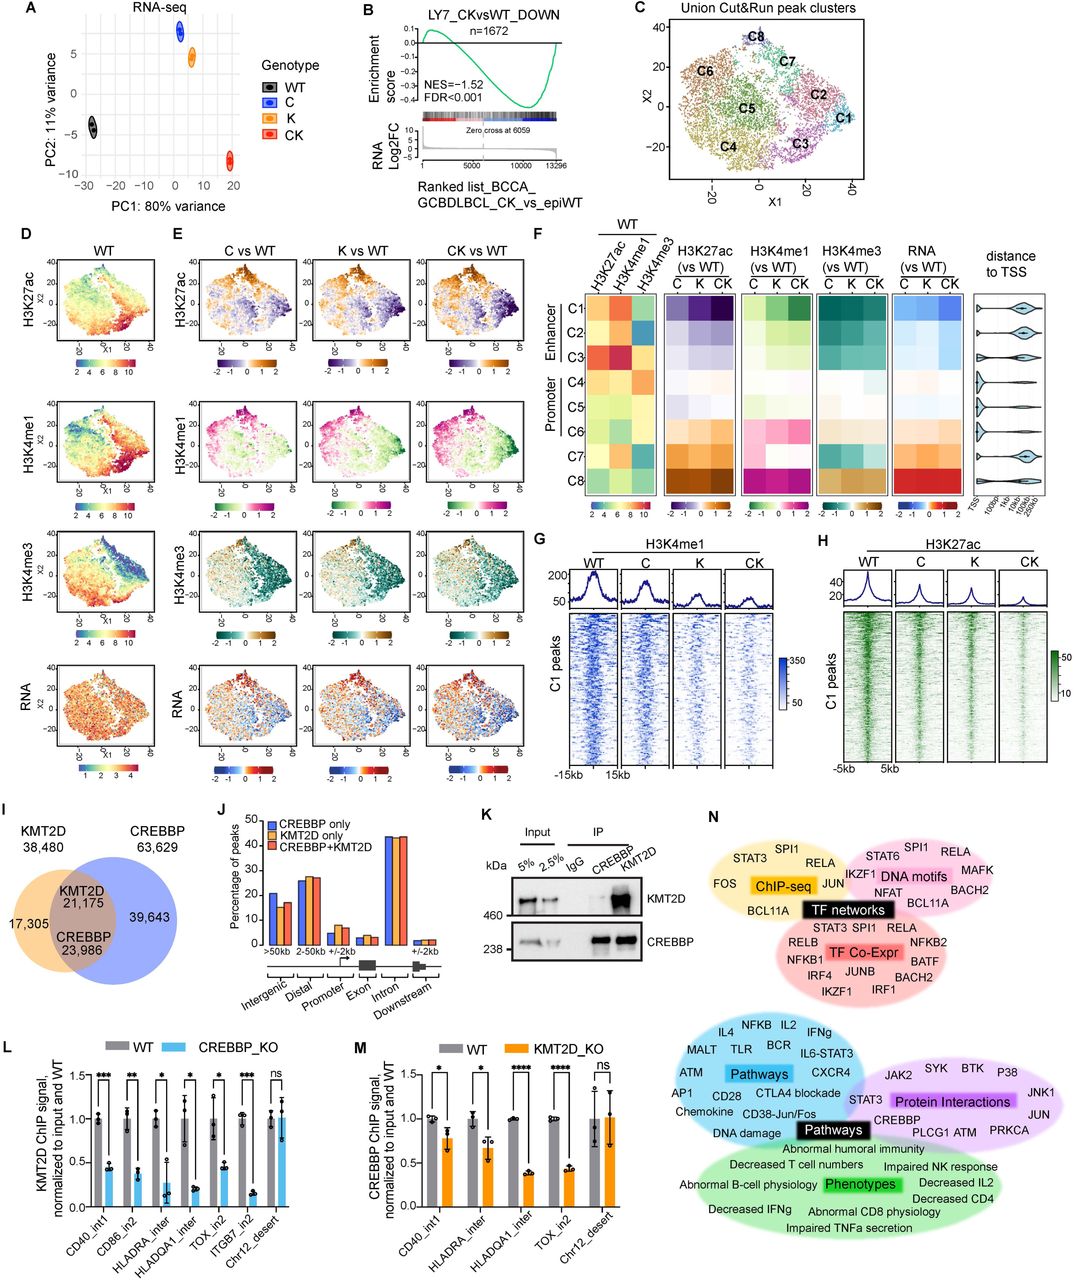
Figure Lengend Snippet: A , PCA analysis of RNA-seq datasets done in isogenic human OCI-Ly7 GCB-DLBCL cell lines (n=2 per genotype) using all genes normalized by VST. B , GSEA plot using CK vs WT downregulated genes in OCI-Ly7 as gene set against ranked gene list based on CK vs epigenetic WT (epiWT, no mutations in CREBBP , KMT2D , and EZH2 ) RNA-seq datasets of human BCCA cohort GCB-DLBCL patients. NES, normalized enrichment score. The p value was calculated by an empirical phenotype-based permutation test. The FDR is adjusted for gene set size and multiple hypotheses testing. C , t-SNE dimensionality reduction and K-means clustering of union peaks, generated by taking the union of H3K4me3, H3K4me1, and K3K27ac CUT&RUN signals from all isogenic OCI-Ly7 cell lines (WT, C, K, and CK), produced eight distinct clusters (named as C1-C8). D , t-SNE plots showing the basal level and distribution pattern of the indicated histone marks or RNA in WT OCI-Ly7 cells. The projected values are VST normalized counts. E , Read density changes for the indicated histone marks and RNA were projected onto t-SNE plots. The projected values are log2FC signal between the indicated genotypes. F , Heatmaps showing median VST normalized read density (left) or read density change (median log2FC) in C/K/CK relative to WT (middle and right) of the indicated histone marks or RNA-seq for each cluster defined in panel C . Distance to TSS plot shows the distance of union peaks to their closest TSSs. G-H , Average signal profiles (top) and heatmaps (bottom) displaying ( G ) H3K4me1 and ( H ) H3K27ac CUT&RUN signals around peak summit (+/-15kb) or peak center (+/-5kb), respectively at C1 peak regions. I , Venn diagram displaying overlap between CREBBP and KMT2D ChIP-seq peaks in OCI-Ly7. J , Genomic feature annotation of CREBBP-unique, KMT2D-unique, and CREBBP/KMT2D-co-bound ChIP-seq peaks. The definitions for different genomic features are depicted below the bar plot. K , Co-IP for assessing interaction between endogenous CREBBP and KMT2D in OCI-Ly7. CREBBP, KMT2D and IgG control were immunoprecipitated from OCI-Ly7 nuclear extracts. Western blots were performed using anti-CREBBP and KMT2D antibodies. L-M , ChIP-qPCR quantifying binding of endogenous ( L ) KMT2D and ( M ) CREBBP at the indicated gene loci in the indicated isogenic OCI-Ly7 cell lines. ChIP signals from three independent experiments were normalized to input and then to WT and presented as mean ± SD. The p values were calculated by unpaired t test and BH adjusted for multiple comparisons and denoted as follows: ns p > 0.05; *p < 0.05; **p < 0.01; ***p < 0.001; ****p < 0.0001. N , Functional annotation of C1 genes (n=401) by Enrichr and Toppgene ( , ).
Article Snippet: HiFi Cas9 Nuclease (IDT; 1081061), Alt-R CRISPR-Cas9 tracrRNA (
Techniques: RNA Sequencing, Generated, Produced, ChIP-sequencing, Co-Immunoprecipitation Assay, Control, Immunoprecipitation, Western Blot, ChIP-qPCR, Binding Assay, Functional Assay
Journal: Human Molecular Genetics
Article Title: PD-linked CHCHD2 mutations impair CHCHD10 and MICOS complex leading to mitochondria dysfunction
doi: 10.1093/hmg/ddy413
Figure Lengend Snippet: Generation of human isogenic lines harboring PD-related CHCHD2 mutants. ( A ) PD-associated CHCHD2 mutants T61I, Q126X and R145Q on functional domains of human CHCHD2 protein. CHCH domain. ( B ) Schematic overview depicting human CHCHD2 locus and Cas9 targeting strategy with designed guide RNA recognized exon 3 sequences in human CHCHD2 locus. ( C ) Sanger sequencing chromatogram showing the heterozygous point mutation leading to Q126X+/−. Representative results from Q10 were shown. ( D ) Sanger sequencing chromatogram on the reverse DNA strand showing the heterozygous point mutation leading to R145Q+/− (R4), the homozygous point mutant leading to R145Q−/− (R17) at the targeting locus of H9 (+/+) hESCs. * the blocking nonsense mutation to enhance the specificity of Cas9 system.
Article Snippet: Capped and polyadenylated
Techniques: Functional Assay, Sequencing, Mutagenesis, Blocking Assay
Journal: International journal of oncology
Article Title: Inhibition of basal cell carcinoma cells by cold atmospheric plasma‑activated solution and differential gene expression analysis.
doi: 10.3892/ijo.2020.5009
Figure Lengend Snippet: Figure 9. After 3, 6 and 12 h treatment with PAS, the expression of cas3/cle‑cas3 and cas9/cle‑cas9 in TE354T cells is analyzed by western blotting. Changes in cas3/cle‑cas3 and cas9/cle‑cas9 protein expression in TE354T cells after PAS treatment by (A) western blotting and (B) subsequent densitometry. **P<0.01 vs. respective con. (C) Changes in the ratio of cle‑cas3/cas3 and cle‑cas9/cas9 after PAS treatment. Data are presented as the mean ± SD of three independent experiments. **P<0.01 vs. respective 0 h. PAS, plasma‑activated solution; cas3, caspase 3; cle, cleaved; cas9, caspase 9; con, control; NS, not significant.
Article Snippet: CAP, cold atmospheric plasma; NS, not significant. antibodies used for Cas3, cleaved Cas3 and cleaved Cas9 were goat rabbit anti‐lgG (cat. no. ZB2301; OriGene Technologies, Inc.); the secondary antibodies used for
Techniques: Expressing, Western Blot, Control
Journal: Proceedings of the National Academy of Sciences of the United States of America
Article Title: Cas9-mediated gene-editing frequency in microalgae is doubled by harnessing the interaction between importin α and phytopathogenic NLSs.
doi: 10.1073/pnas.2415072122
Figure Lengend Snippet: Fig. 2. Standardization of the method for increasing the cellular permeability of proteinaceous materials across the cell wall and plasma membrane. (A) A simplified schematic depicting the nuclear localization of the Cas9 RNP. The internalization pathway is indicated by a thick arrow. The associated molecular interactions are shown with thin arrows. The NPC is highlighted with a dashed circle. The cartoon is not to scale. (B) Cell wall attenuation was tested by cotreatment with a plasma membrane-lysing detergent, Triton X-100. (Scale bar, 18.5 μm.) (C) Localization of mCherry reporter without NLS by confocal microscopy. (Scale bar, 5 μm.) (D) Box and whisker plots demonstrate the fluorescence ratio (as a measure of localization) for mCherry reporter. (E) Reagent-dependent permeability was reproducibly observed using flow cytometry. (F) Localization of Alexa 488-labeled Cas9 without NLS (Cas9ΔNLS) by confocal microscopy. (Scale bar, 5 μm.) (G) Box and whisker plots demonstrate the fluorescence ratio for Alexa 488-labeled Cas9ΔNLS. (H) Reagent-dependent permeability was reproducibly observed using flow cytometry for Alexa 488-labeled Cas9ΔNLS. (C and F) NM, CB, and GL stand for normal medium (TAP medium), commercial buffer for transformation (see Materials and Methods for details), and gametolysin, respectively. (D and G) Data were derived from four biological replicates and quantified using ImageJ software. The median (the center line) ± whiskers (1.5 × the interquartile range of the lower and upper quartiles) are shown. Student’s t test was performed. Statistical significances and fold-changes are presented. The region of interest for the quantification is visualized in the inset. (E and H) PE and FITC represent the phycoerythrin and fluorescein isothiocyanate channels, respectively, for detection of the fluorescence emitted by the proteins. Populations (%) above the threshold intensity are indicated.
Article Snippet: All plasmids encoding Cas9 variants designed in this study were constructed using pET- NLS- Cas9- 6 × His (Addgene #62934) (50) and
Techniques: Permeability, Clinical Proteomics, Membrane, Confocal Microscopy, Whisker Assay, Fluorescence, Flow Cytometry, Labeling, Transformation Assay, Derivative Assay, Software

Journal: Proceedings of the National Academy of Sciences of the United States of America
Article Title: Cas9-mediated gene-editing frequency in microalgae is doubled by harnessing the interaction between importin α and phytopathogenic NLSs.
doi: 10.1073/pnas.2415072122
Figure Lengend Snippet: Fig. 3. Binding of Cas9 nucleases fused independently with each NLS at the N- and C-terminus to CrImpαΔIBB. (A) West- ern blot analysis to confirm the proper expressions of the recombinant adaptor, CrImpαΔIBB, and the Cas9 variants in E. coli, including Cas9ΔNLS used for visual localization assays (Fig. 2 F–H), detected by anti-FLAG and anti-His antibodies, respec- tively. GroEL: an endogenous control. The diagram shows the secondary structure of each NLS-tagged Cas9 protein, its no- menclature, and the corresponding NLS sequence it contains. The antiparallel binding modes are presented. BS stands for the BS. (B) co-IP assay was conduct- ed with anti-FLAG antibody on lysates from E. coli cells expressing FLAG-tagged CrImpαΔIBB (as bait) and poly-histidine- tagged Cas9 variants, which were alterna- tively fused to each NLS at both termini (as prey), as shown in the right panel. CL: cell lysate. (C) ELISA result. In the legend, the best-fit values from each 4-parameter logistic sigmoidal fit are given as binding affinities. Two biological and two techni- cal replicates (a total of quadruplication) were tested for each combination. Inset: magnified graph around the inflection point. Dashed box briefly illustrates the microplate platform of the assay. (D) MST results reproducibly show comparable affinities to the ELISA for the same posi- tionally NLS-fused Cas9 variants (i.e., DN and SN Cas9).
Article Snippet: All plasmids encoding Cas9 variants designed in this study were constructed using pET- NLS- Cas9- 6 × His (Addgene #62934) (50) and
Techniques: Binding Assay, Recombinant, Control, Sequencing, Co-Immunoprecipitation Assay, Expressing, Enzyme-linked Immunosorbent Assay

Journal: Proceedings of the National Academy of Sciences of the United States of America
Article Title: Cas9-mediated gene-editing frequency in microalgae is doubled by harnessing the interaction between importin α and phytopathogenic NLSs.
doi: 10.1073/pnas.2415072122
Figure Lengend Snippet: Fig. 4. Visual confirmation of localization using NLS-bearing mCherry reporters and Cas9 variants, and in vitro cleavage assay of NLS-fused Cas9 variants. (A) Design and preparation of mCherry reporters with two different NLS fusion positions, as indicated. mCherry without NLS was identically used in the previous assay (Fig. 2 C–E). (B) Proper expression of the reporters was confirmed by western blot. GroEL: an endogenous control. Circled numbers denote the reporter variants according to the assignments in Fig. 4A. (C) Confocal microscopy-based localization assay using various mCherry variants. (Scale bar, 5 μm.) (D) Confocal microscopy-based localization assay using various Alexa 488-labeled Cas9 variants. (Scale bar, 5 μm.) (C and D) Cells were simultaneously stained with DAPI to detect the nucleus. (E) Box and whisker plots show the fluorescence ratio (as a localization measure) derived from four biological replicates and quantified using ImageJ software. The median (the center line) ± whiskers (1.5 × the interquartile range of the lower and upper quartiles) are shown. Student’s t test was performed. The fold-changes are presented with the statistical significance. The region of interest for the quantification is indicated in the inset. (F) Expected cut site and lengths of the resulting cleavage fragments when PCR-amplified MAA7 (Cre03.g161400) gene of C. reinhardtii is subjected to in vitro cleavage. cCas9 indicates a commercial Cas9. cPAM: complementary protospacer adjacent motif; U.D.: uncleaved DNA (i.e., intact PCR product); and C.F.: cleavage fragment. (G) Representative cleavage result using different molecular combinations at the end of the assay (after 90 min). No cleavage was evident when one of the essential components was missing (for cases I, II, and III). M: marker; N.A.: not applicable. (H) Kinetic analysis of in vitro cleavage performance. Two biological replicates were tested. Uncleaved fraction (%) was analyzed from the gel images in SI Appendix, Fig. S12 using ImageJ software. The data were fitted based on one phase exponential decay model. The Arabic numbers indicate the Cas9 variants according to the numbering in Fig. 4G.
Article Snippet: All plasmids encoding Cas9 variants designed in this study were constructed using pET- NLS- Cas9- 6 × His (Addgene #62934) (50) and
Techniques: In Vitro, Cleavage Assay, Expressing, Western Blot, Control, Confocal Microscopy, Labeling, Staining, Whisker Assay, Fluorescence, Derivative Assay, Software, Amplification, Marker

Journal: Proceedings of the National Academy of Sciences of the United States of America
Article Title: Cas9-mediated gene-editing frequency in microalgae is doubled by harnessing the interaction between importin α and phytopathogenic NLSs.
doi: 10.1073/pnas.2415072122
Figure Lengend Snippet: Fig. 5. In vivo application of Cas9 variants for algal mutagenesis and investigation of the genetic variance as a result of NHEJ. (A) Representative plate images obtained from the mutagenesis of C. reinhardtii by each Cas9 variant. (B) Simplified description of a strain selection strategy based on tryptophan auxotrophy, when the MAA7 gene is disrupted. The synthesis of the proteinogenic amino acid, L-Trp, from intracellularly synthesized indole is impaired by ΔMAA7. It also deprives cells of the ability to synthesize the cytotoxic, nonproteinogenic amino acid, 5-Fluoro-L-Trp, which is produced when 5-fluoroindole is supplied extracellularly. (C) Mutagenesis frequencies from two scoring methods, namely the number of colony formations and short-read deep sequencing (SR deep seq.), are compared. The absence and presence of L-Trp and 5-FI in each assay are indicated below two vertical axes. The mutation frequencies from the SR deep seq. were corrected with the error rate from the WT sample (SI Appendix, Table S2) and are presented as bars. The individual colony count data are shown as dots with biological triplicates. Floating bars represent the mean. Student’s t test was performed on the frequencies from the colony counts. The fold-changes are presented together with the statistical significance. The mutagenesis frequency is further calibrated with the mutagenesis efficiency calculated from the Sanger sequencing results (Table 2). (D) Exemplified Sanger sequencing data processing is shown (Dataset S2). In: insertion; Del: deletion; Sub: substitution; M: marker; PAM: PAM; and N.A.: not applicable. The nomenclature of the mutant library follows the previous convention, while the numbering of each strain follows the order of random selection for Sanger sequencing. (E) Statistics of genetic variation resulting from NHEJ. CI: complex indel; TN: true negative, genetically identical to WT; NS: not sequenced, including sequencing errors and unamplified cases; and ME: mutagenesis efficiency (%). (F) Length variation is shown with normalized counts (%). The numbers of Sanger sequenced strains are given.
Article Snippet: All plasmids encoding Cas9 variants designed in this study were constructed using pET- NLS- Cas9- 6 × His (Addgene #62934) (50) and
Techniques: In Vivo, Mutagenesis, Variant Assay, Selection, Synthesized, Produced, Sequencing, Marker

Journal: Proceedings of the National Academy of Sciences of the United States of America
Article Title: Cas9-mediated gene-editing frequency in microalgae is doubled by harnessing the interaction between importin α and phytopathogenic NLSs.
doi: 10.1073/pnas.2415072122
Figure Lengend Snippet: Fig. 6. Validation of cross-species versatility using Chlorella Sp. HS2. (A) The three-dimensional structure of the putative Impα (Hscell_00006266) in Chlorella Sp. HS2 was predicted using AlphaFold. The structural homology provided a rationale for applying the NLS-mediated delivery enhancement strategy. Armadillo repeat motifs (Arms) in the predicted structure are presented. N and C termini are indicated. A microscopic image of Chlorella Sp. HS2 is shown at the Upper Right. (Scale bar, 3 μm.) (B) Representative plate images (from replicate 1 in SI Appendix, Table S3) obtained from the mutagenesis of Chlorella Sp. HS2 targeting the MAA7 gene by each Cas9 variant. (C) Mutagenesis frequencies from the targeted mutagenesis frequency derived from colony formation followed by Sanger sequencing and SR deep seq. are compared. The absence and presence of L-Trp and 5-FI in each assay are indicated below two vertical axes. The mutation frequencies from the SR deep seq. were corrected with the error rate from the WT sample (SI Appendix, Table S4) and are presented as bars. The individual targeted mutagenesis frequency data are shown as dots with technical triplicates. Floating bars represent the mean. Student’s t test was performed on the targeted mutagenesis frequencies. The fold-changes are presented together with the statistical significance.
Article Snippet: All plasmids encoding Cas9 variants designed in this study were constructed using pET- NLS- Cas9- 6 × His (Addgene #62934) (50) and
Techniques: Biomarker Discovery, Mutagenesis, Variant Assay, Derivative Assay, Sequencing